£165,000
End of Terrace, 2 bed
Ellacott Garth, YO25 5FZ
£165,000
End of Terrace, 2 bed
Ellacott Garth, YO25 5FZ

Compare 60 local agents, data from 833 active listings


We track 60 estate agents actively marketing properties across the YO25 postcode area, covering Driffield, Bridlington, Hornsea, and the surrounding East Riding villages. We've analysed every agent's current listings, pricing strategies, and market presence to bring you a comprehensive ranking that helps you find the right partner for your property sale.
The YO25 property market offers diverse opportunities, from traditional market town properties in Driffield to coastal living in Bridlington and Hornsea. With 833 properties currently for sale and an average asking price of £291,390, this is a dynamic market where choosing the right estate agent can make a significant difference to your sale outcome. Our platform provides transparent data on every agent's performance so you can make an informed decision.
selling a family home in Driffield, a seaside cottage in Bridlington, or a modern property in Hornsea, the right estate agent brings local knowledge, marketing expertise, and negotiation skills that can add thousands to your final sale price. We compare agents across listings, market share, pricing strategies, and customer reviews to help you find your perfect match.

60
Active Estate Agents
£291,390
Average Asking Price
833
Properties For Sale
The YO25 postcode area has demonstrated steady price growth, with house prices increasing by 2% year-on-year according to recent Land Registry data. After accounting for inflation, prices rose by 2.3% in the last year, or -1.6% after inflation adjustment, showing resilient demand in this East Riding market town corridor. The overall average house price stands at approximately £252,811, with significant variation across property types and specific postcode sectors.
Sector-level analysis reveals interesting trends, with the YO25 5 sector around Driffield showing particularly strong performance at 2.5% annual growth, or -1.3% after inflation. Our data, drawn from 1,188 sales across the YO25 area in the past 24 months, indicates consistent transaction volumes that reflect a healthy, functioning market. The relationship between asking prices (£291,390 average) and achieved sold prices (£252,811) suggests realistic pricing expectations among sellers in this area.
Detached properties command the highest values at an average of £348,090, reflecting the premium that buyers place on space and privacy in this rural district. Semi-detached homes average £207,517, while terraced properties average £162,434. The flat market remains modest with approximately 21 listings at an average of £90,950, catering primarily to first-time buyers and those seeking lock-up-and-leave coastal options. The data confirms that YO25 remains a market where property type significantly influences achievable prices, and understanding these nuances is crucial for sellers.
The rental market in YO25 also shows healthy activity, with 39 rental properties currently available through 9 active letting agents. Average rental prices sit around £830 per month for standard properties, with Ullyotts leading the rental market with 14 listings. This rental activity indicates strong investor interest and a steady flow of tenants, which can influence the overall property market dynamics.
Based on 458 live listings with an average asking price of £324,838.
Source: home.co.uk
See which agents are selling fastest and at the best prices in YO25.
Compare Estate Agents FreeThe YO25 market benefits from significant new build activity, with several major developments bringing modern properties to the area. Barratt Homes is currently delivering Mortimer Park on Long Lane in Driffield (YO25 5HF), offering 2, 3, and 4 bedroom homes ranging from £150,000 to £353,000. Keepmoat's Poppy Place development on the A614 in Driffield (YO25 5UR) provides additional options with prices from £189,995 for a 2-bedroom home up to £349,995 for a 4-bedroom detached property.
David Wilson Homes' Porters Way development on Cemetery Lane offers 3 and 4 bedroom homes priced from £227,000 to £368,000, while G P Atkin's Dawnay Park brings a mix of 1, 2, 3, and 4 bedroom properties including bungalows to the Driffield town centre area. For those looking further afield, Harron Homes' Chariot's Keep in Wetwang (YO25 9XR) offers 2, 3, 4, and 5 bedroom homes and bungalows from £240,000 to £515,000. These new builds represent approximately 8-12% of current available stock, providing buyers with modern energy-efficient options alongside the area's traditional housing stock.
Transaction volumes remain healthy with data based on 1,188 sales in the past 24 months across the YO25 postcode. The market sees strong activity in the £200,000-£300,000 price band, which accounts for 261 of the 833 current listings, representing the sweet spot for family homes in this area. Four-bedroom properties are particularly well-represented with 233 listings, showing strong demand from families upsizing in this attractive rural district with good schools and transport links to Hull and York.
The YO25 postcode encompasses the market town of Driffield alongside coastal towns of Bridlington and Hornsea, creating a diverse residential landscape that appeals to various buyer demographics. Driffield itself serves as a thriving market town with a Conservation Area protecting its historic character, including buildings of special architectural and historic interest. The town offers excellent amenities including supermarkets, independent shops, schools, and leisure facilities, making it a popular choice for families and commuters alike.
The geological landscape of the East Riding presents important considerations for property owners. The area features clay-rich soils typical of the region, which present shrink-swell risks that can affect foundations, particularly during periods of drought or excessive rainfall. Property surveys in this area frequently identify damp-related issues, particularly in older solid-walled properties where rising damp and penetrating damp are common defects. The British Geological Survey's GeoSure data indicates ground stability considerations that buyers should factor into their property decisions.
Flood risk in the East Riding requires specific attention, with the Environment Agency identifying areas along Holderness Drain, Monk Dyke, and Foredyke south of Driffield as flood warning areas. While the general flood risk remains low for most YO25 properties, those near rivers, watercourses, or with a history of surface water flooding should obtain appropriate flood risk reports. The coastal erosion risk affecting other parts of the East Riding is less relevant for inland YO25 properties but remains a consideration for the coastal towns within the broader area.
Transport connectivity makes YO25 attractive to commuters, with Driffield offering regular rail services to Hull, York, and beyond. The A164 and A166 roads provide road connections to the regional centres, while the proximity to Hull's ferry links adds international connectivity. Local employers include those in the agricultural, manufacturing, and service sectors, with the public sector also providing significant employment. The combination of rural charm, good transport links, and reasonable property prices continues to attract buyers seeking a balance between town and country living.
The YO25 area features a mix of established high-street agencies and smaller local operators, each with distinct specialisms and market coverage. Ullyotts dominates the local market with 18.7% market share and 156 active listings at an average price of £257,303, making them the go-to agent for mainstream properties across Driffield and the surrounding villages. Their extensive local presence and deep community connections position them as the default choice for many sellers in the area.
Dee Atkinson & Harrison competes strongly with 15.4% market share and 128 listings averaging £285,963, while Beercocks holds 10% of the market with properties averaging £248,301. For those with higher-value properties, Hunters focuses on the premium end with an average asking price of £378,912 across their 34 listings, and Fine & Country (operated by Beercocks) handles properties averaging £737,632, catering to the top end of the local market. Understanding which agent matches your property type and price point is essential for achieving the best outcome.
When selecting an estate agent in YO25, consider whether you need a high-street agent with physical office presence and local expertise, or whether an online agent might suit your requirements. High-street agents like Ullyotts and Dee Atkinson & Harrison offer face-to-face valuations, local market knowledge, and established buyer networks, typically charging percentage fees of 1-3% plus VAT. Online agents offer lower fixed fees typically between £999 and £1,999 but require more seller involvement in viewings and marketing. The average commission in this area sits around 1.5% plus VAT, though negotiating is common.
Smaller agents also play important roles in the local market. Belt Estate Agency in Bridlington offers 11 listings averaging £209,527, while Our House Estate Agents in Hornsea provides 8 listings at an average of £220,606. Link Agency covers the broader East Yorkshire area with 7 listings averaging £358,571, demonstrating how some agents operate across multiple towns within the YO25 region.
Start by comparing agents active in YO25, looking at their current listings, average asking prices, and market share. Agents like Ullyotts, Dee Atkinson & Harrison, and Beercocks have significant local presence, while others may specialize in specific property types or price ranges. Check which agents have the strongest presence in your specific town or neighbourhood.
Request free valuations from at least three agents. This gives you comparison data and helps you understand your property's realistic market value. Be wary of agents who overvalue to win your business, as overpriced properties sit on the market and eventually sell for less. A good agent will provide evidence-based valuations backed by comparable local sales data.
Ask about each agent's marketing approach, including their online presence, social media activity, local advertising, and database of registered buyers. In YO25, agents with strong local networks and digital marketing can significantly impact your property's visibility. Find out which platforms they use and how they plan to showcase your property to potential buyers.
Examine the agency agreement carefully, paying attention to the contract duration (typically 8-16 weeks for sole agency), fees, and termination clauses. Multi-agency options are available but typically cost 0.5-1% more in total fees. Ensure you understand what happens if your property doesn't sell within the initial contract period.
Look for agent memberships with professional bodies like The Property Ombudsman, NAEA Propertymark, or ARLA Propertymark. Online reviews and testimonials from local sellers provide valuable insight into an agent's communication and performance. Ask for references from recent sellers in your area if possible.
Don't accept the first fee quoted. Agents are often willing to negotiate, especially if you can demonstrate you've received competing quotes. Remember that the cheapest agent isn't always the best value if they achieve a lower sale price. Consider the total value including marketing reach, not just the headline fee percentage.
Estate agent fees in YO25 typically range from 1% to 3% plus VAT. The average is around 1.5% plus VAT. Always get quotes from at least three agents and negotiate. Some agents will match or beat competitor quotes, and many are willing to reduce their fees to secure your business, especially for higher-value properties.
The bedroom distribution across YO25 listings reveals clear market segmentation and pricing patterns that sellers should understand. Three-bedroom properties dominate the market with 305 listings averaging £261,096, representing the most active segment where families and first-time upsizers compete for available stock. This bedroom count accounts for approximately 37% of all available properties, making it a competitive space where pricing strategy is crucial.
Four-bedroom properties represent the second largest segment with 233 listings at an average of £393,079, appealing to families seeking additional space and the premium buyers who value larger homes. Two-bedroom properties remain popular with 213 listings averaging £185,216, attracting first-time buyers and those downsizing. The data shows that one-bedroom properties average just £84,717 across 23 listings, while five-bedroom homes command £490,562 on average, with six and seven-bedroom properties reaching £662,000 and £665,000 respectively.
Analysis of price per square foot shows that smaller properties in YO25 tend to achieve higher values per square foot compared to larger homes, a pattern common in many UK markets. Properties priced in the £200,000-£300,000 band show the strongest buyer activity, with 261 current listings competing for buyer attention. Understanding where your property sits in this bedroom and price distribution helps set realistic expectations and informs strategic pricing decisions when marketing your home.
Price range analysis reveals further market insights, with 241 listings in the £100,000-£200,000 range and 226 properties in the £300,000-£500,000 bracket. Higher-value properties above £500,000 represent 72 listings, while premium properties over £750,000 account for 15 available homes. This distribution shows a healthy market across all price points, with particular strength in the mid-range family home sector.
Understanding the predominant property types in YO25 helps sellers position their homes effectively for target buyers. Detached properties represent the largest segment with 262 listings averaging £386,203, appealing to families seeking space and privacy in this rural area. Semi-detached properties number 144 listings at an average of £224,137, while terraced homes offer more affordable options with 70 listings averaging £199,229. Flats remain limited with just 21 listings at £90,950, primarily attracting first-time buyers or those seeking coastal lock-up-and-leave properties.
The construction methods and materials used in YO25 properties vary significantly by age and location. Traditional buildings commonly use natural materials such as earth, stone, brick, and timber, with clay bricks being particularly prevalent in the region. Modern new build developments like those at Mortimer Park and Poppy Place use contemporary cavity wall construction with brick and block. Properties in Driffield's Conservation Area may feature older construction methods that require specialist consideration during surveys.
Common defects identified in properties throughout the East Riding include damp and moisture problems, particularly rising damp in older solid-walled homes and penetrating damp from roof or wall defects. Roof issues such as missing tiles, leaks, and poor insulation are frequently noted in survey reports. Structural movement related to clay soil shrink-swell behaviour can affect foundations, especially during periods of drought or excessive rainfall. Outdated electrical systems and poor drainage are also common concerns in older properties throughout the YO25 area.
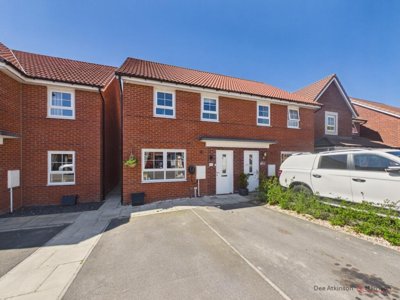
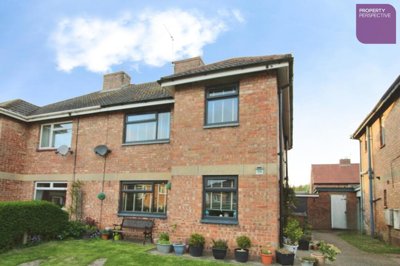
458 properties currently listed across YO25. Here are the most recently added.
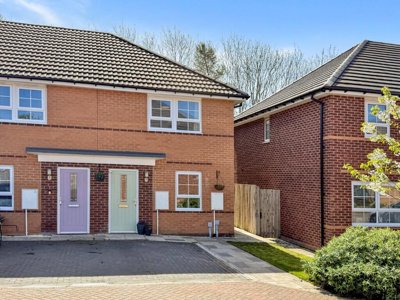
£165,000
End of Terrace, 2 bed
Ellacott Garth, YO25 5FZ
£165,000
End of Terrace, 2 bed
Ellacott Garth, YO25 5FZ
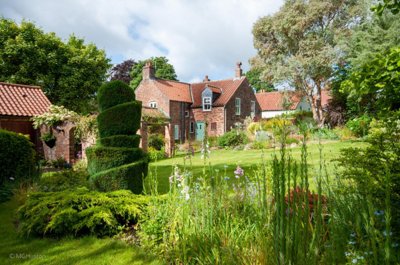
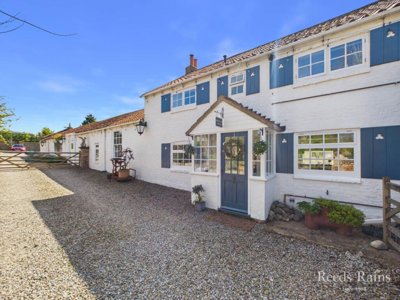
£499,950
Detached, 4 bed
Main Street, YO25 9LA
£499,950
Detached, 4 bed
Main Street, YO25 9LA
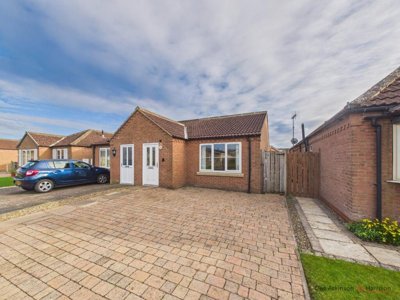
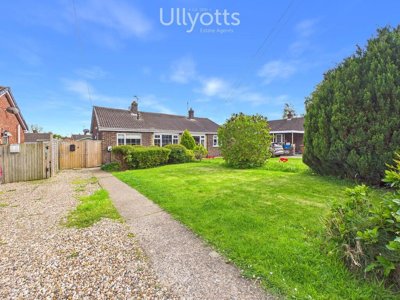
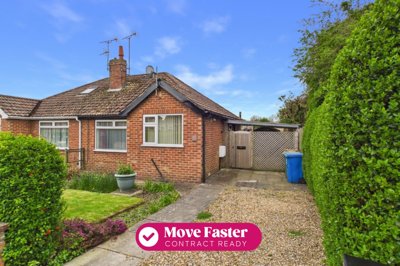
£185,000
Semi-Detached Bungalow, 2 bed
Mill Rise, YO25 5BL
£185,000
Semi-Detached Bungalow, 2 bed
Mill Rise, YO25 5BL
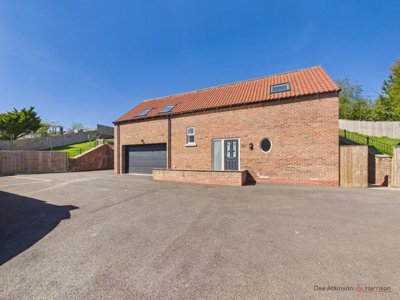
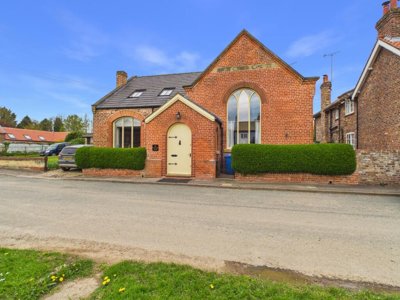
£350,000
Detached, 3 bed
South End Close, YO25 3UB
£350,000
Detached, 3 bed
South End Close, YO25 3UB
£220,000
Semi-Detached, 3 bed
Nalton Drive, YO25 5GE
£220,000
Semi-Detached, 3 bed
Nalton Drive, YO25 5GE
£215,000
Semi-Detached, 3 bed
Main Street, YO25 8AY
£215,000
Semi-Detached, 3 bed
Main Street, YO25 8AY
£195,000
Semi-Detached Bungalow, 2 bed
Cherry Drive, YO25 4LY
£195,000
Semi-Detached Bungalow, 2 bed
Cherry Drive, YO25 4LY
£185,000
Semi-Detached, 2 bed
Eastgate South, YO25 6LU
£185,000
Semi-Detached, 2 bed
Eastgate South, YO25 6LU
£169,995
Semi-Detached, 3 bed
Northfield Crescent, YO25 5ES
£169,995
Semi-Detached, 3 bed
Northfield Crescent, YO25 5ES
£595,000
Semi-Detached, 3 bed
Hunmanby Road, YO25 3PT
£595,000
Semi-Detached, 3 bed
Hunmanby Road, YO25 3PT
£165,000
Semi-Detached Bungalow, 2 bed
The Mount, YO25 5JQ
£165,000
Semi-Detached Bungalow, 2 bed
The Mount, YO25 5JQ
£475,000
Detached, 3 bed
Front Street, YO25 9SH
£475,000
Detached, 3 bed
Front Street, YO25 9SH
Get free, no-obligation valuations from the top-performing local agents. Compare fees, services, and track records before you decide.
Compare Agents FreeBased on current market share data, Ullyotts leads with 18.7% of the market and 156 active listings, followed by Dee Atkinson & Harrison at 15.4% and Beercocks at 10%. However, the best agent depends on your property type and price range. Hunters and Fine & Country focus on the premium market with higher average prices, while Beercocks and Willowgreen offer strong coverage across mid-range properties. For coastal properties in Bridlington or Hornsea, agents like Belt Estate Agency and Quick & Clarke have specific local expertise.
Estate agent fees in YO25 typically range from 1% to 3% plus VAT (1.2% to 3.6% including VAT), with the average around 1.5% plus VAT. For a property priced at the YO25 average of £291,390, this would equate to fees between £3,497 and £10,490 including VAT. Online agents offer fixed-fee alternatives typically ranging from £999 to £1,999, though these usually require greater seller involvement in viewings and marketing activities.
Yes, house prices in YO25 increased by 2% year-on-year, with the YO25 5 sector around Driffield showing 2.5% growth. After inflation adjustment, prices showed -1.6% change, indicating modest real-term growth. The overall average sold price is approximately £252,811 based on recent transaction data from 1,188 sales in the past 24 months. The market shows realistic pricing expectations with asking prices averaging £291,390 closely aligned with achieved sale prices.
YO25 encompasses the market town of Driffield alongside coastal towns of Bridlington and Hornsea, offering a mix of rural charm and seaside living. The area features good local amenities, schools, and transport links to Hull and York. Driffield has a Conservation Area protecting its historic character, and the surrounding East Riding offers beautiful countryside. Considerations include clay soil foundations (shrink-swell risk) and some surface water flood areas near watercourses like Holderness Drain and Monk Dyke.
The market is dominated by detached properties with 262 listings averaging £386,203, followed by semi-detached (144 listings at £224,137), terraced (70 listings at £199,229), and flats (21 listings at £90,950). The three-bedroom sector is most active with 305 current listings, making it the most competitive segment for sellers. Four-bedroom family homes represent 233 listings, showing strong demand from upsizers in the area.
Several major developments are underway including Barratt Homes' Mortimer Park in Driffield (from £150,000), Keepmoat's Poppy Place (from £189,995), David Wilson Homes' Porters Way (from £227,000), G P Atkin's Dawnay Park in Driffield town centre, and Harron Homes' Chariot's Keep in Wetwang (from £240,000). These new builds represent approximately 8-12% of current available stock and offer modern energy-efficient options with NHBC warranty coverage.
While specific data for YO25 isn't available, average UK sale times range from 8 to 16 weeks from listing to completion. Properties priced correctly and marketed effectively by competent agents tend to sell faster. The YO25 market shows healthy transaction volumes with 1,188 sales in the past 24 months, indicating active buyer demand. Properties in the popular £200,000-£300,000 band typically see quicker sales due to strong buyer competition.
Local agents like Ullyotts and Dee Atkinson & Harrison offer established high-street presence, local market expertise, and face-to-face service, though at higher percentage fees. Online agents offer lower fixed fees but require more seller involvement. For premium properties, consider specialists like Hunters or Fine & Country. For standard properties, the local knowledge of established YO25 agents often provides better value through achieved sale prices. The average commission rate of 1.5% plus VAT makes high-street agents competitive with online alternatives when considering their full service offering.
Given the local geology and property age, surveys in YO25 should specifically check for damp issues in older solid-walled properties, roof condition given the climate, foundation movement related to clay soils, and any flood risk for properties near watercourses. A RICS Level 2 Survey costs around £400-£600 for standard properties, rising to £600-£900 for larger homes. For older properties in Driffield's Conservation Area or listed buildings, a RICS Level 3 Building Survey is recommended.
Estate Agents In London

Estate Agents In Plymouth

Estate Agents In Liverpool

Estate Agents In Glasgow

Estate Agents In Sheffield

Estate Agents In Edinburgh

Estate Agents In Coventry

Estate Agents In Bradford

Estate Agents In Manchester

Estate Agents In Birmingham

Estate Agents In Bristol

Estate Agents In Oxford

Estate Agents In Leicester

Estate Agents In Newcastle

Estate Agents In Leeds

Estate Agents In Southampton

Estate Agents In Cardiff

Estate Agents In Nottingham

Estate Agents In Norwich

Estate Agents In Brighton

Estate Agents In Derby

Estate Agents In Portsmouth

Estate Agents In Northampton

Estate Agents In Milton Keynes

Estate Agents In Bournemouth

Estate Agents In Bolton

Estate Agents In Swansea

Estate Agents In Swindon

Estate Agents In Peterborough

Estate Agents In Wolverhampton

Compare 60 local agents, data from 833 active listings
Find AgentsHomemove is a trading name of HM Haus Group Ltd (Company No. 13873779, registered in England & Wales). Homemove Mortgages Ltd (Company No. 15947693) is an Appointed Representative of TMG Direct Limited, trading as TMG Mortgage Network, which is authorised and regulated by the Financial Conduct Authority (FRN 786245). Homemove Mortgages Ltd is entered on the FCA Register as an Appointed Representative (FRN 1022429). You can check registrations at NewRegister or by calling 0800 111 6768.
We use cookies to show you personalised content and improve your experience of our website. Find out more in our Privacy policy and Cookie policy.