

























 Kinleigh Folkard & Hayward
 Winkworth
 Foxtons
 Bairstow Eves
 Haart
 Savills
 Barnard Marcus
 The Stow Brothers
 Gibbs Gillespie
 Knight Frank
 Chestertons
 Hunters
 Acorn
 Robinson Jackson
 Coopers
 Balgores
 John Payne
 Stirling Ackroyd
 Martyn Gerrard
Time to sell
typical days from listing to sale agreed, across 486 agencies
- Fastest
- 0 days
- Typical
- 70 days
- Slowest
- 264 days
Compare local agents and find the best one to sell your home.
Book RICS surveyors to check your property before you buy.
Get your new home set up with E.ON Next.
Compare mortgage deals from leading UK lenders.
Get quotes from trusted removal companies near you.
Book professional cleaners for your move-in or move-out.
Find conveyancing solicitors to handle your property sale.
Compare broadband deals available at your new address.
Protect your home with competitive insurance quotes.

1,475 agencies agreed 65,117 sales in London from 9 November 2025 to 8 November 2026. A typical one found a buyer in 70 days. Here's who agreed the most.1

33 boroughs
The agency with the most sales agreed in each borough from 9 November 2025 to 8 November 2026. Each borough has its own page, every agency ranked district by district.
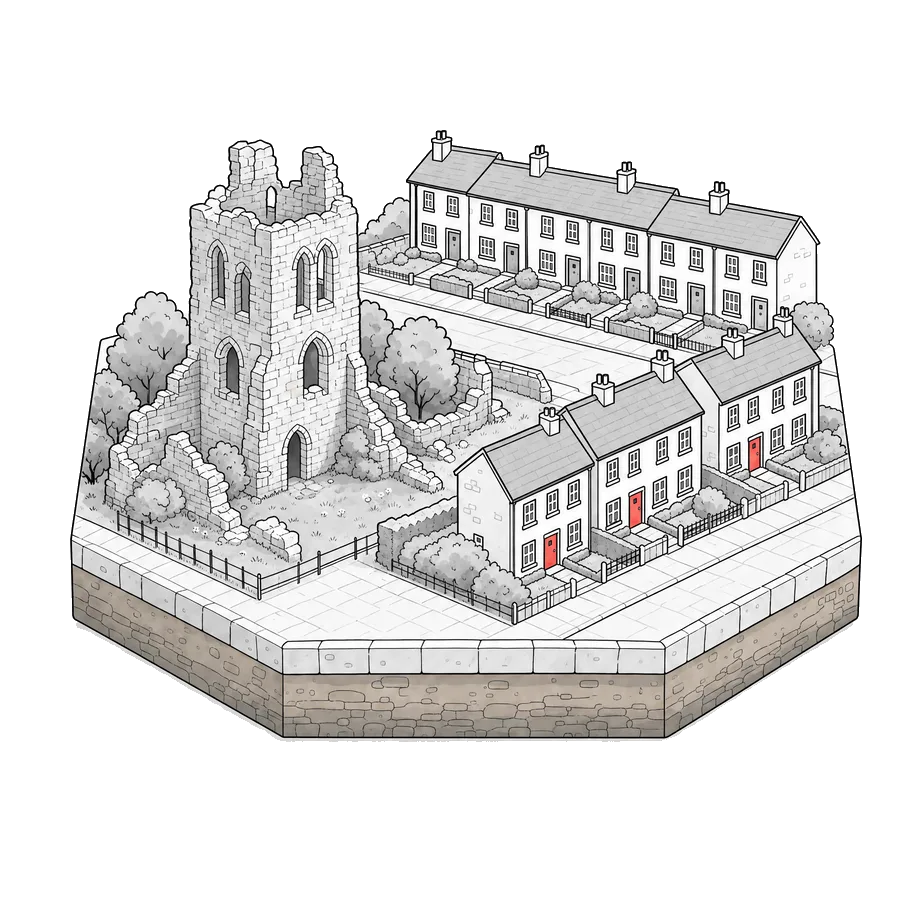
Carter & Willow
21% of 1,250 sales agreed
Barking Abbey and the Becontree estate
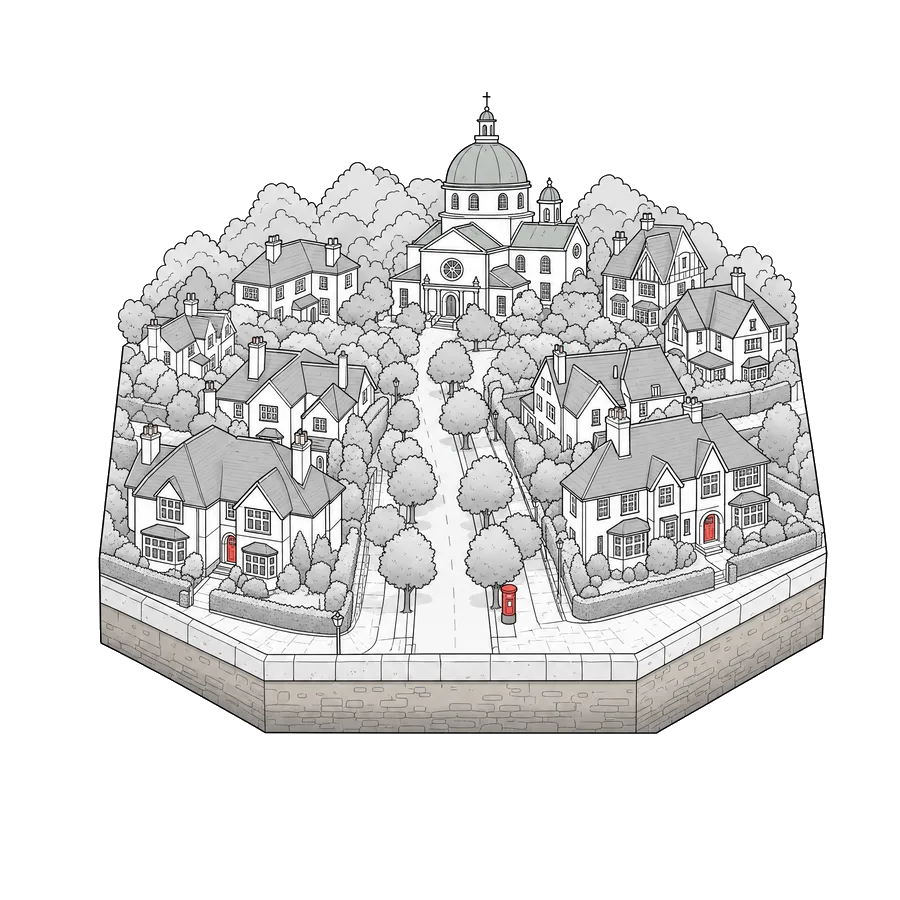
Martyn Gerrard
8.6% of 2,942 sales agreed
Hampstead Garden Suburb and leafy semis
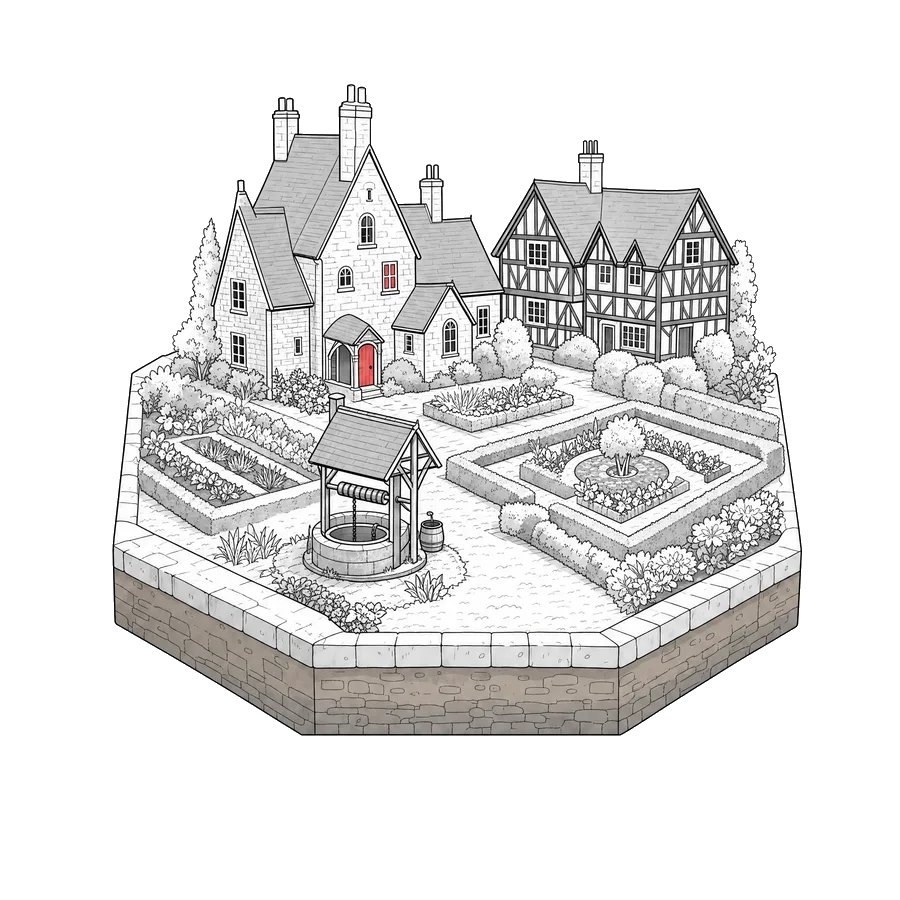
Robinson Jackson
25.3% of 2,610 sales agreed
Hall Place and William Morris's Red House
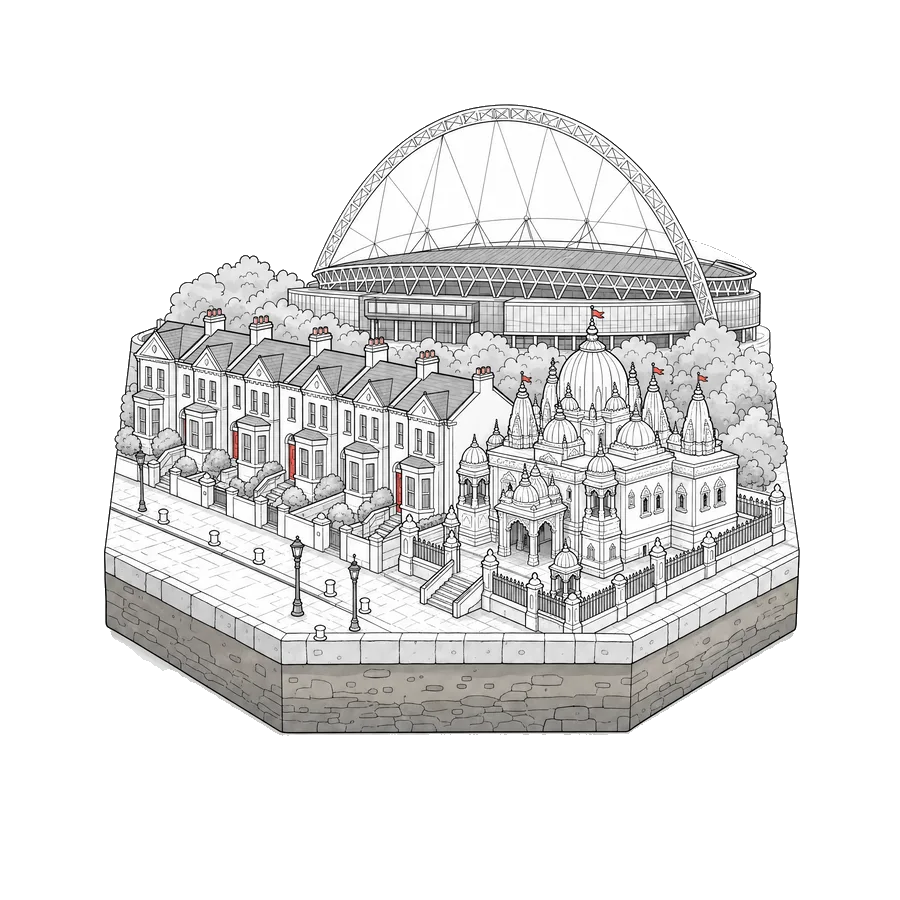
Daniels
8.7% of 1,167 sales agreed
Wembley arch and Neasden Temple
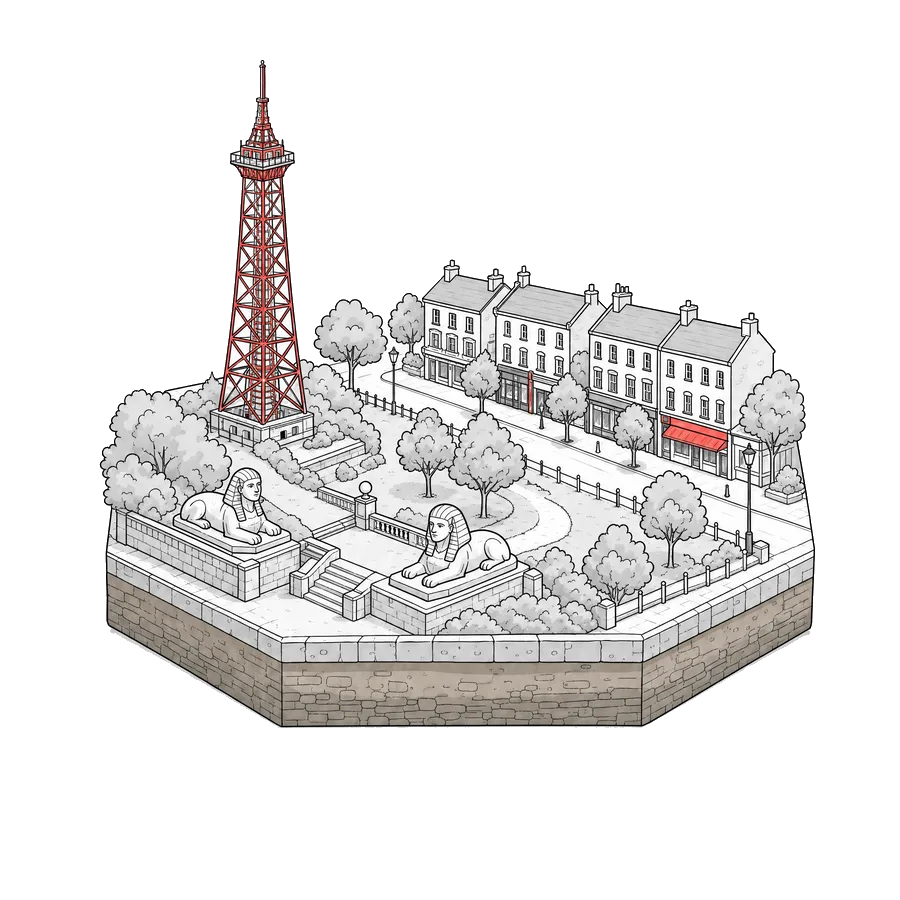
Kinleigh Folkard & Hayward
11.1% of 4,259 sales agreed
Crystal Palace Park's sphinxes and mast
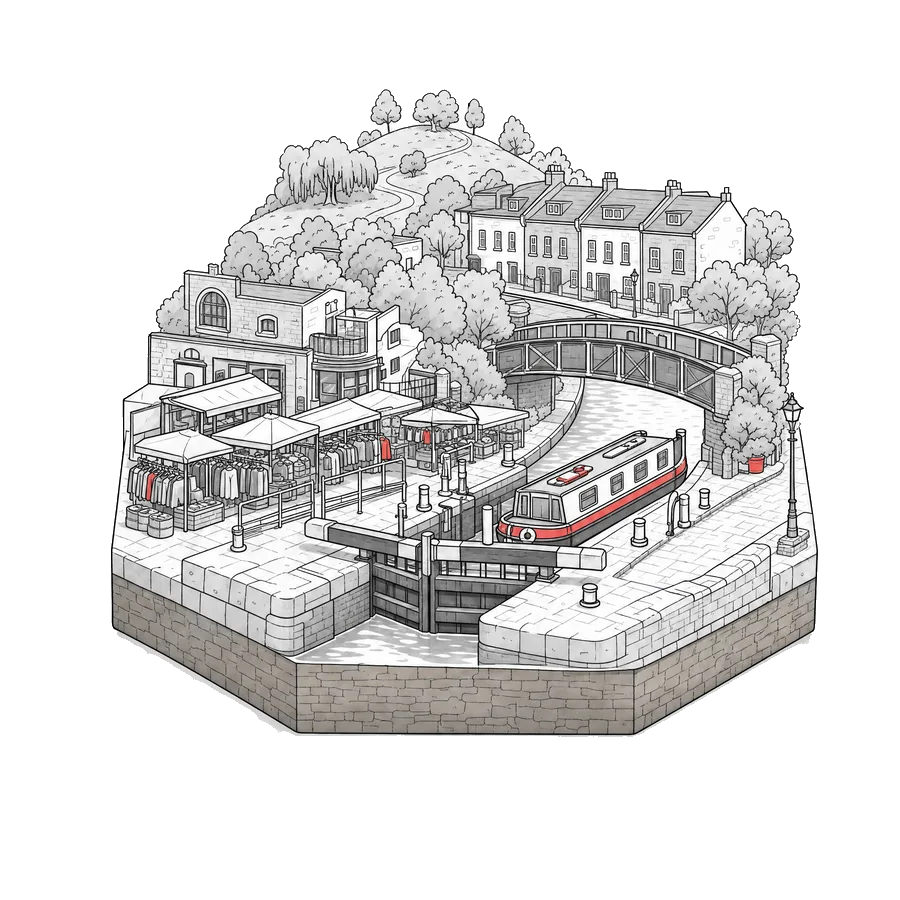
Foxtons
7.5% of 1,527 sales agreed
Camden Lock and the Regent's Canal
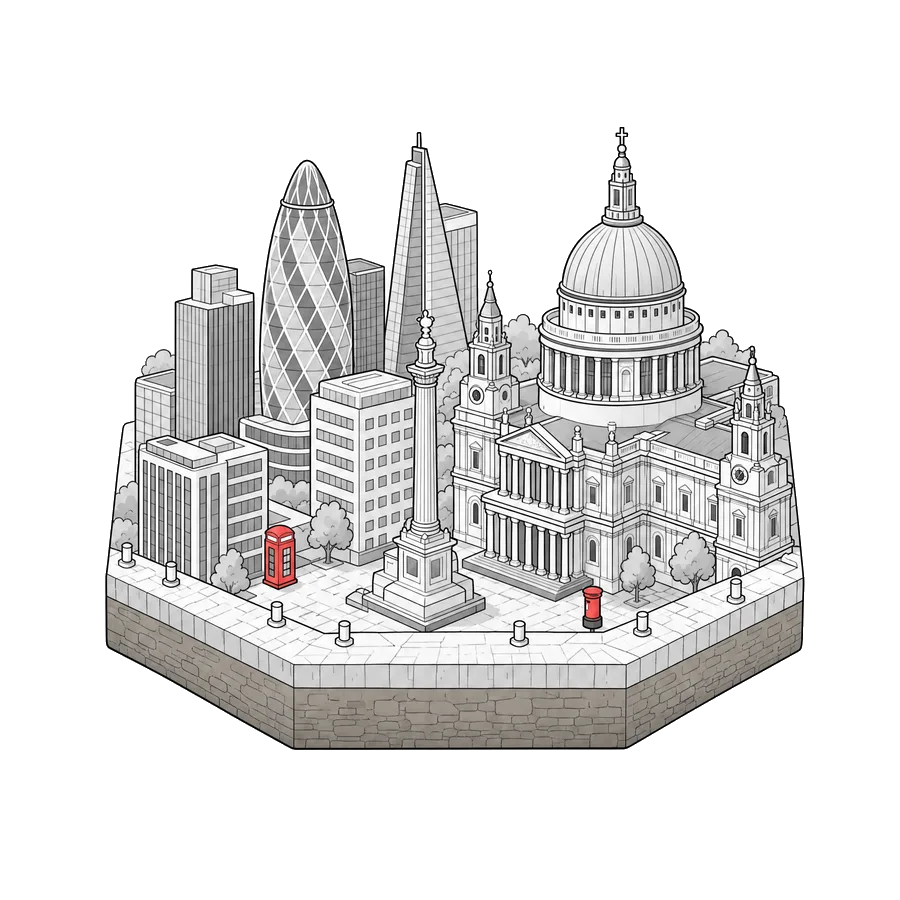
Scott City Residential
18.8% of 69 sales agreed
St Paul's, the Gherkin and the Monument
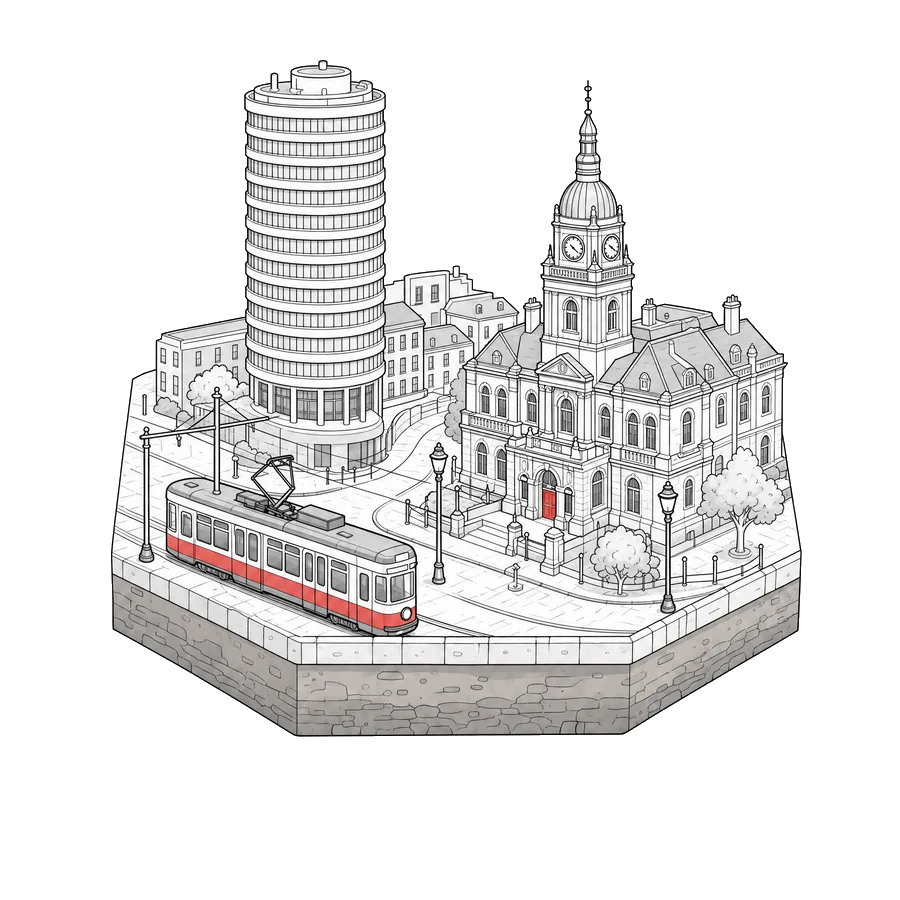
Streets Ahead
6.9% of 3,960 sales agreed
Croydon Town Hall clock and the tram
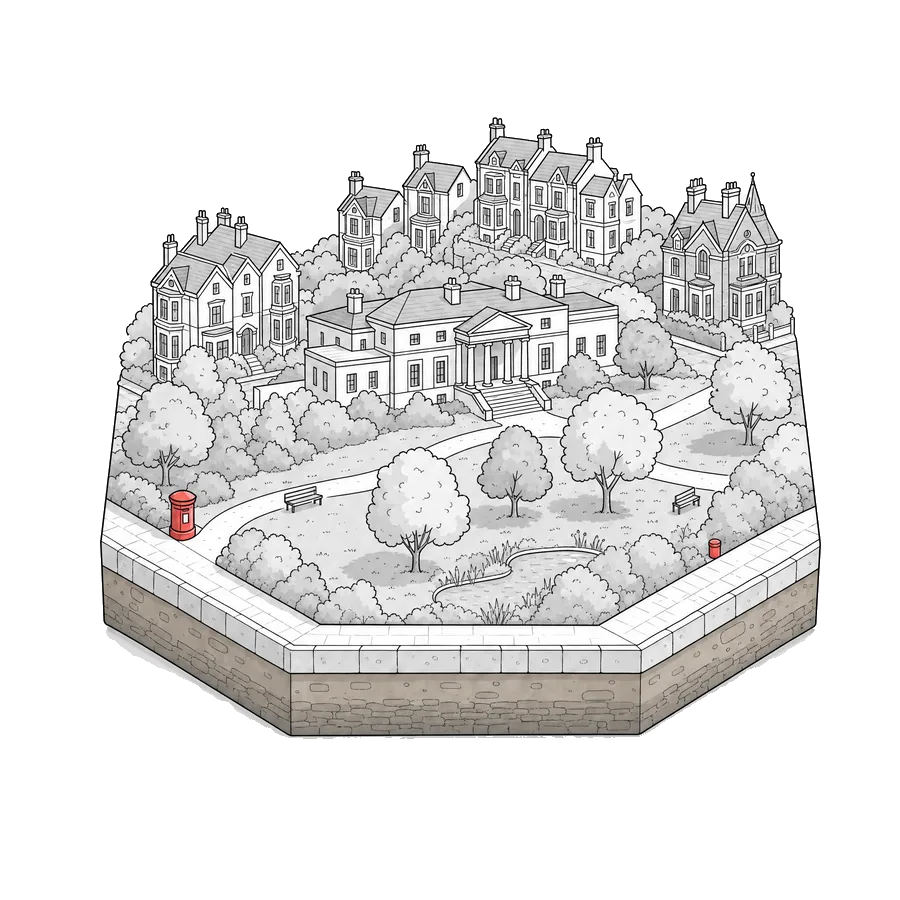
Gibbs Gillespie
8.5% of 2,018 sales agreed
Pitzhanger Manor and Ealing's green
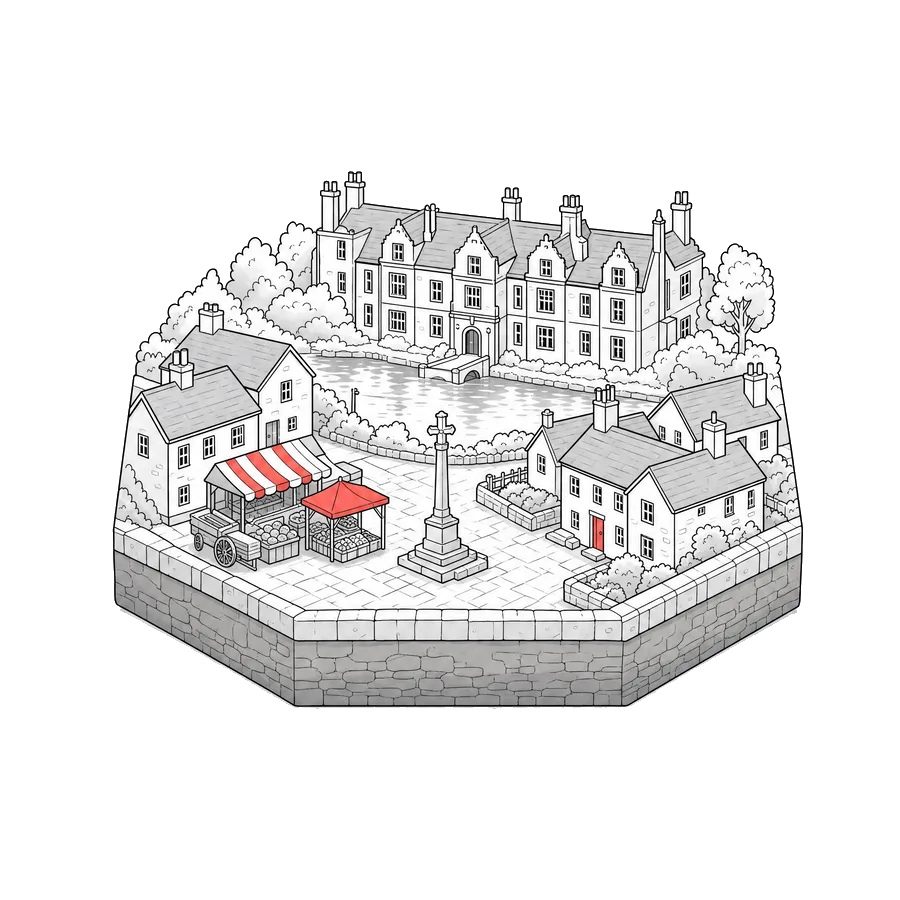
Kings Group
11.5% of 2,355 sales agreed
Forty Hall and the market square
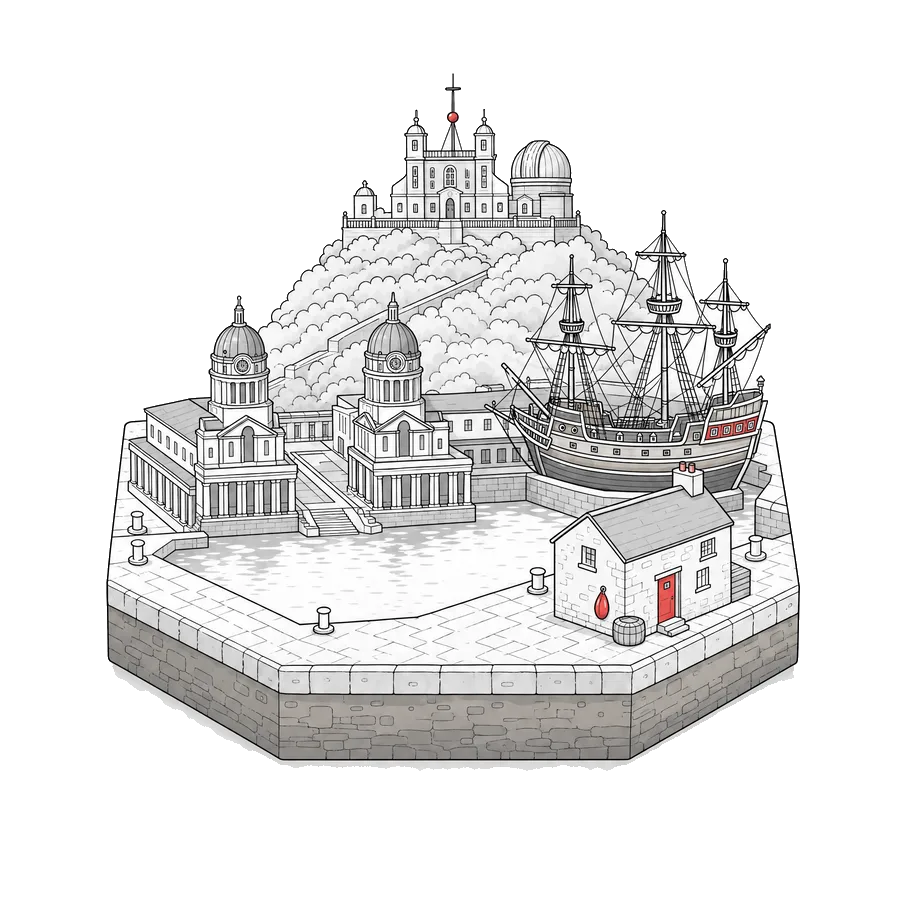
John Payne
16.3% of 2,394 sales agreed
The Cutty Sark and the Naval College
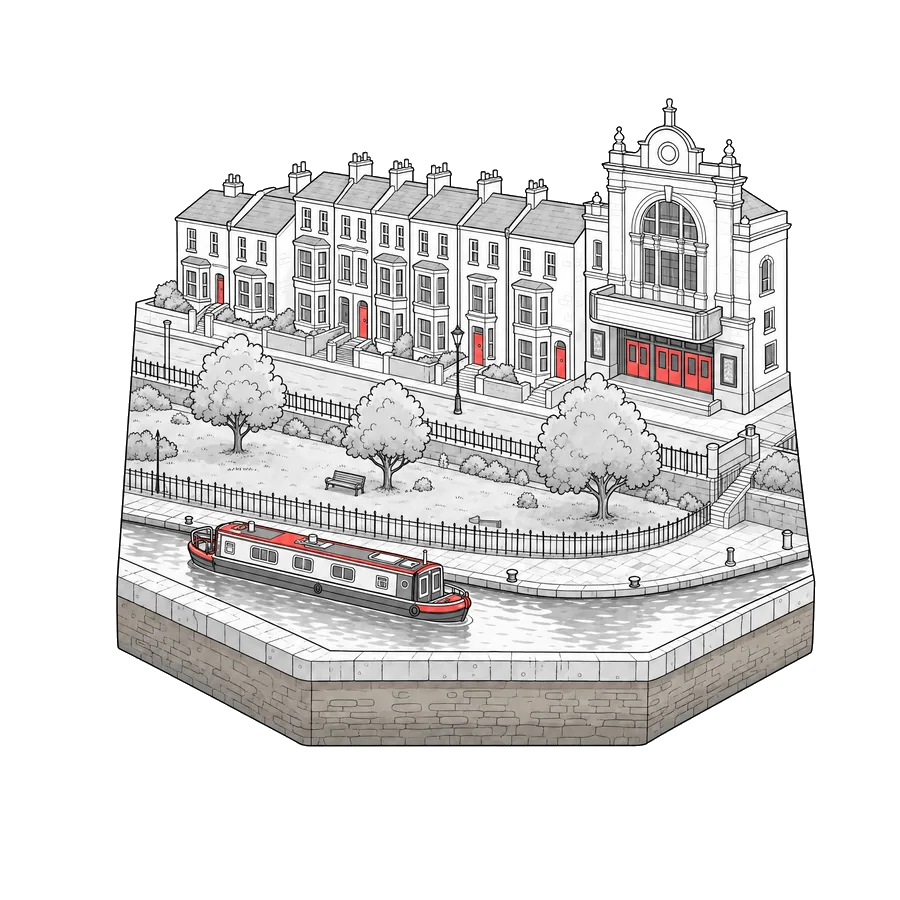
Keatons
7.3% of 1,236 sales agreed
Victorian terraces and London Fields
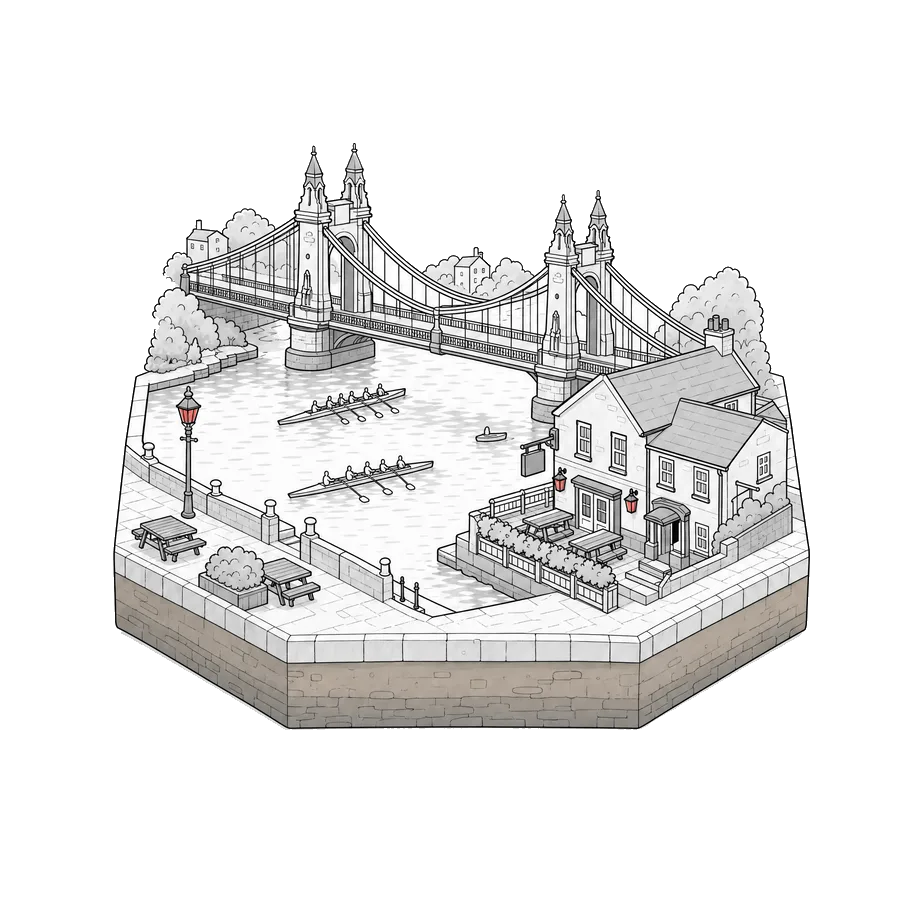
Kinleigh Folkard & Hayward
9.4% of 1,269 sales agreed
Hammersmith Bridge on the Thames
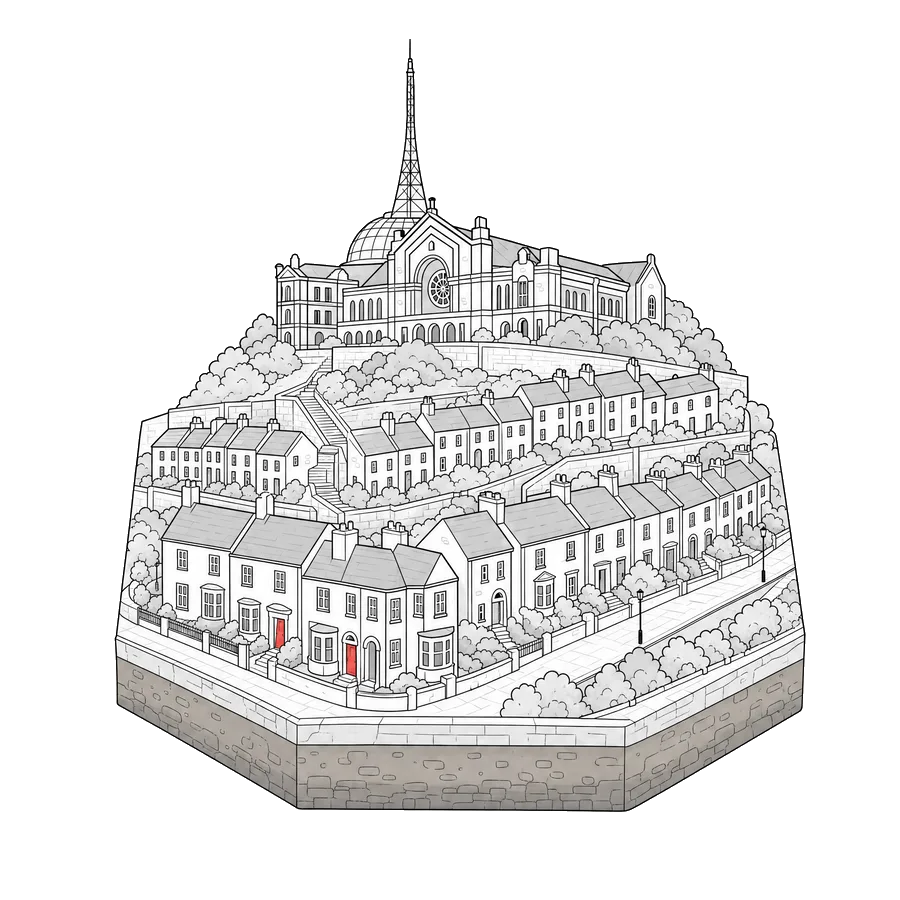
Winkworth
10.7% of 1,999 sales agreed
Alexandra Palace on the hill
Gibbs Gillespie
19.4% of 1,709 sales agreed
Harrow on the Hill's church spire
Balgores
11.8% of 3,589 sales agreed
Romford market and St Edward's spire
Coopers
20.4% of 2,806 sales agreed
Uxbridge Market House and the canal
Oakhill
6.3% of 1,502 sales agreed
Chiswick House and the riverside
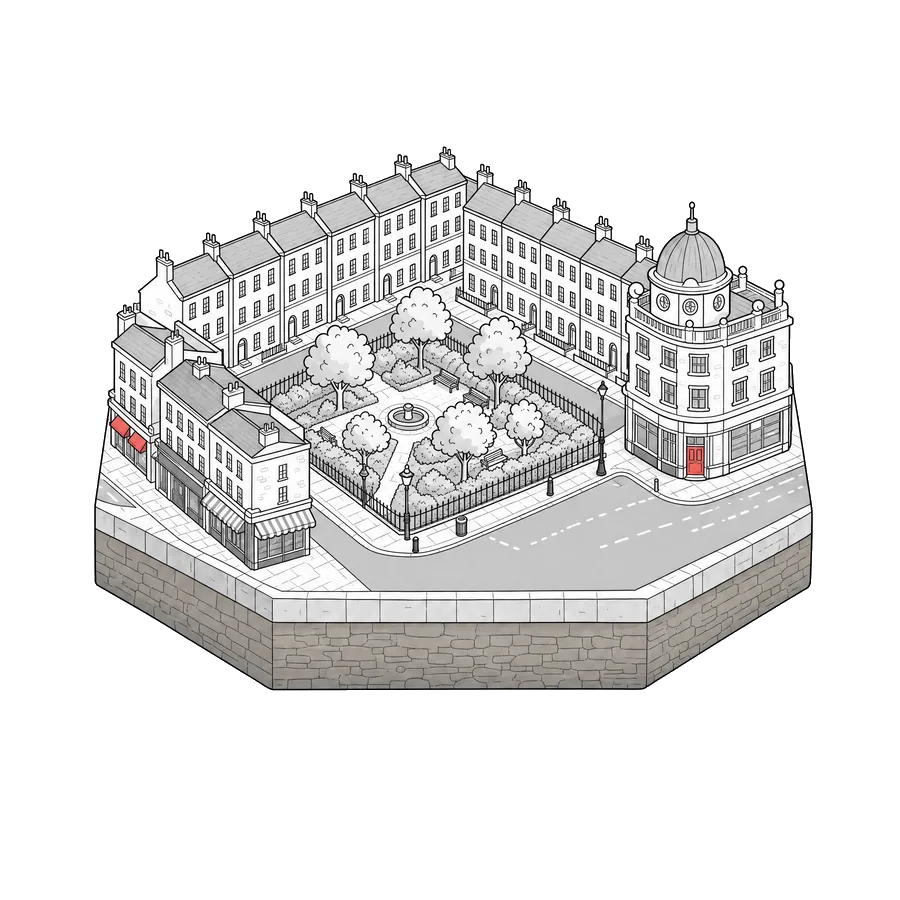
Winkworth
8.4% of 1,566 sales agreed
Georgian squares and the Angel
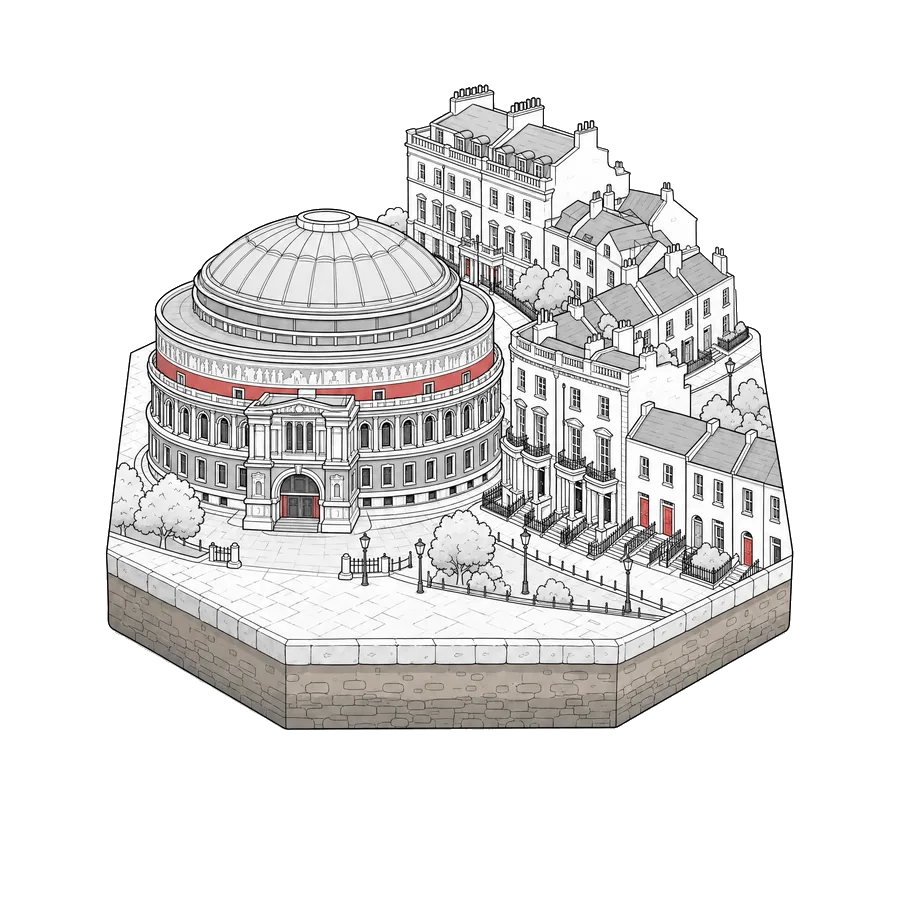
Knight Frank
15.7% of 1,082 sales agreed
Royal Albert Hall and stucco terraces
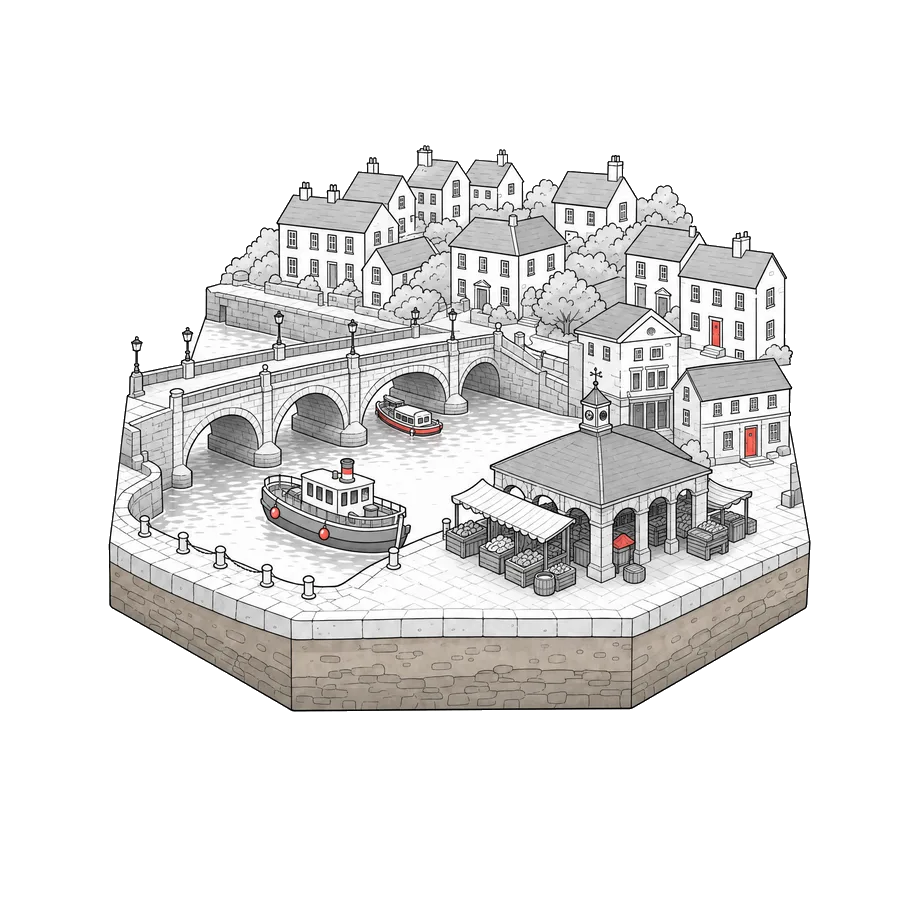
Curchods
12.7% of 1,420 sales agreed
Kingston Bridge and the Market Place
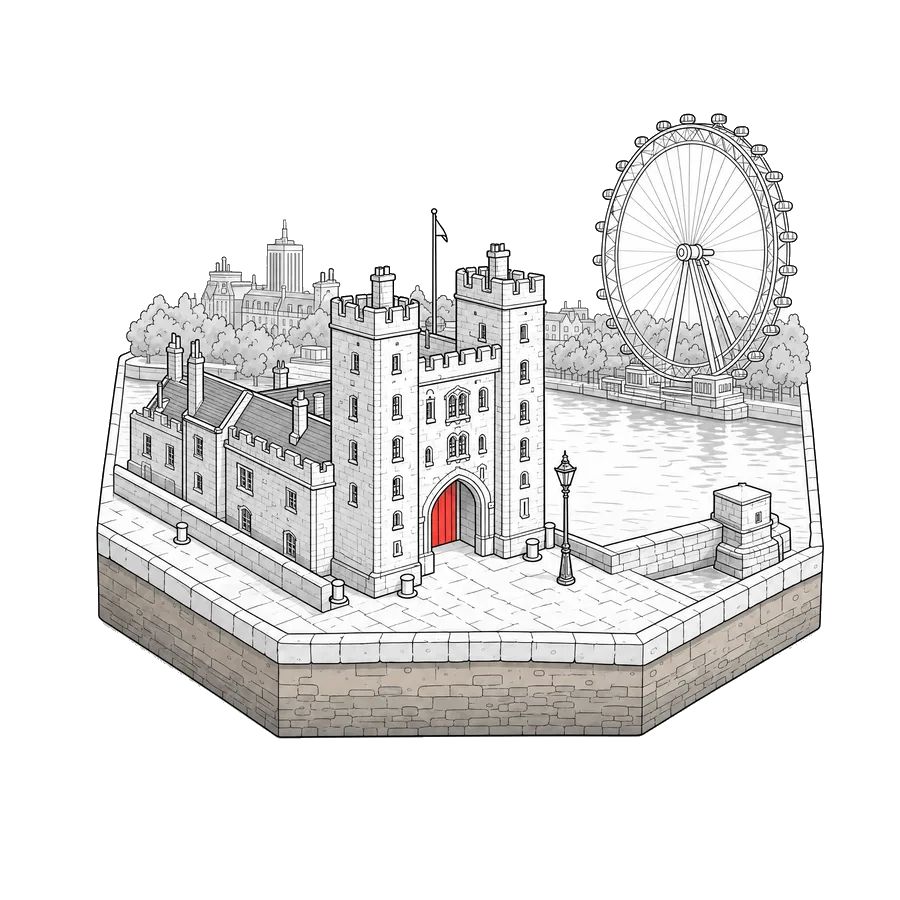
Kinleigh Folkard & Hayward
19.1% of 2,629 sales agreed
Lambeth Palace and the London Eye
Kinleigh Folkard & Hayward
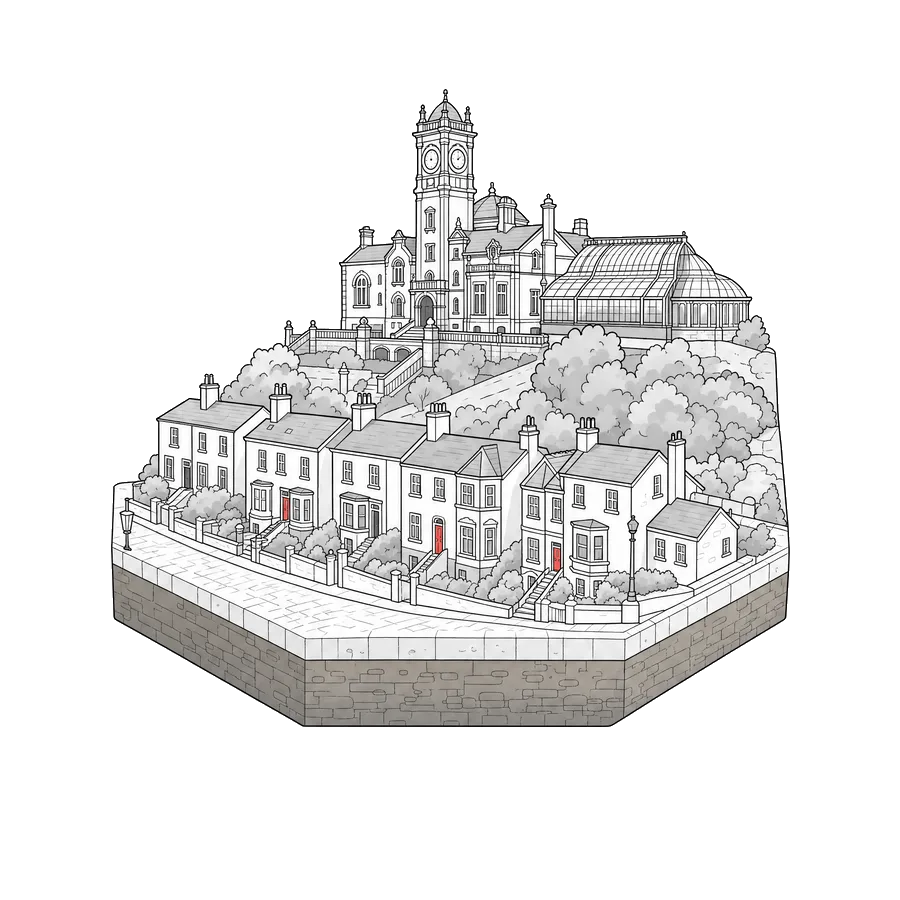
10.6% of 2,554 sales agreed
The Horniman Museum's clock tower
Ellisons
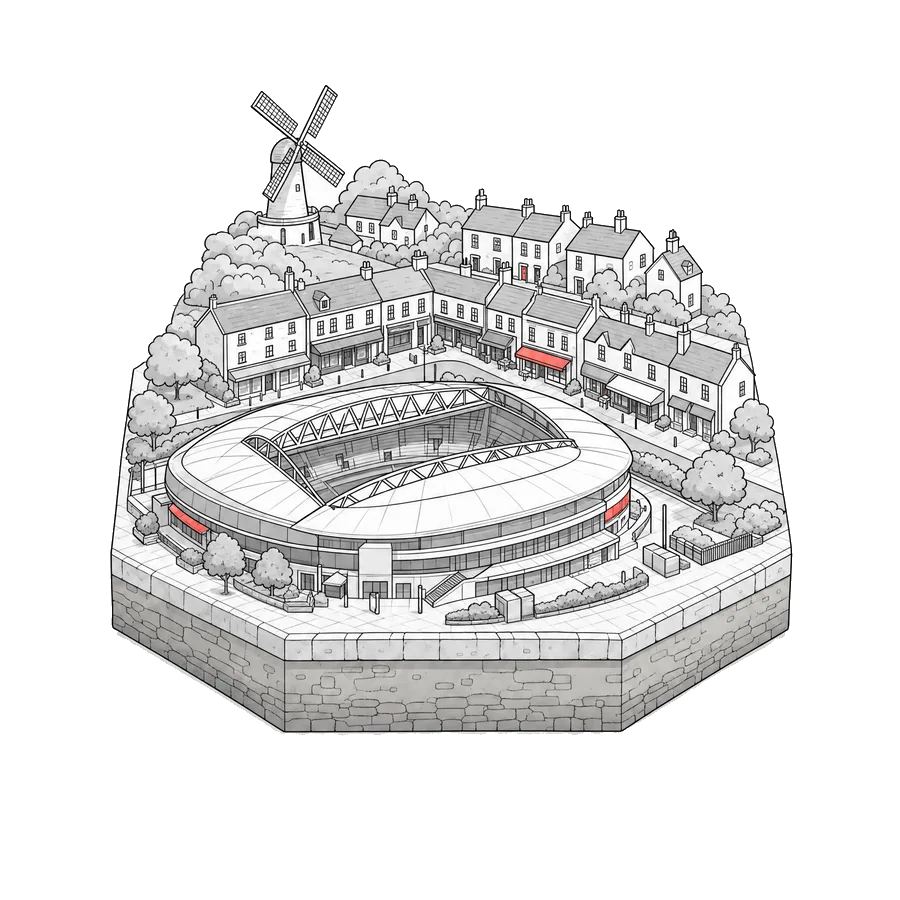
15.5% of 1,815 sales agreed
Wimbledon's Centre Court and windmill
Bairstow Eves
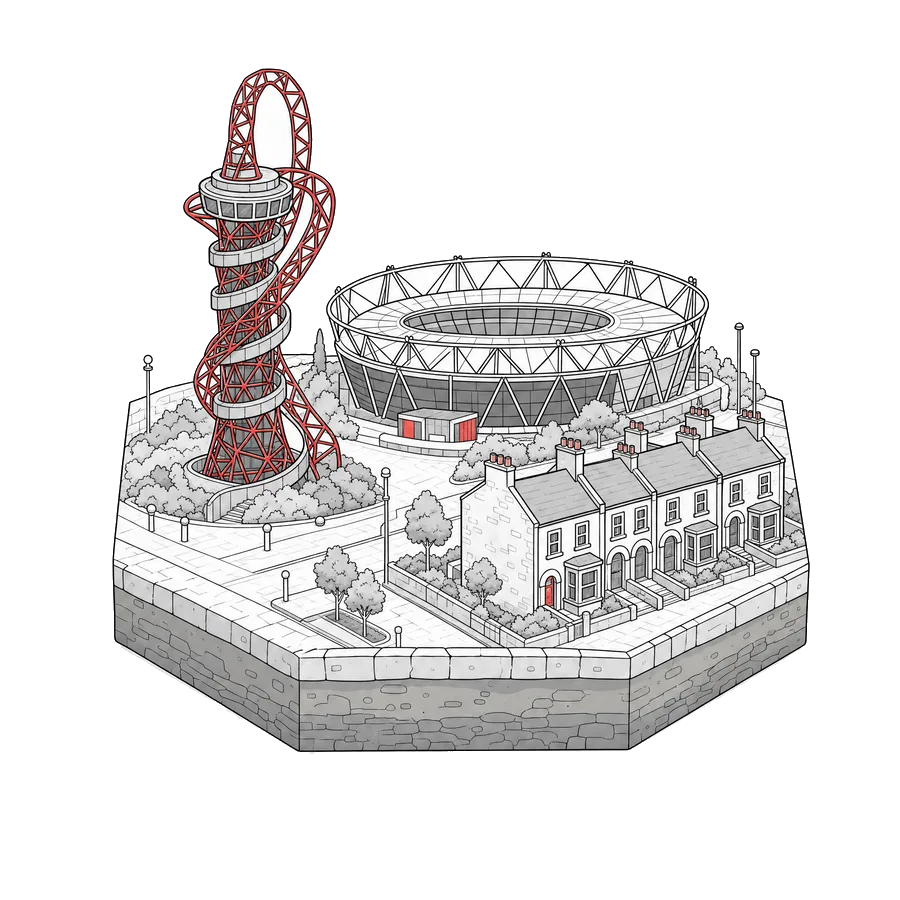
14.4% of 1,724 sales agreed
Olympic Park and the Orbit tower
Bowden Bradley
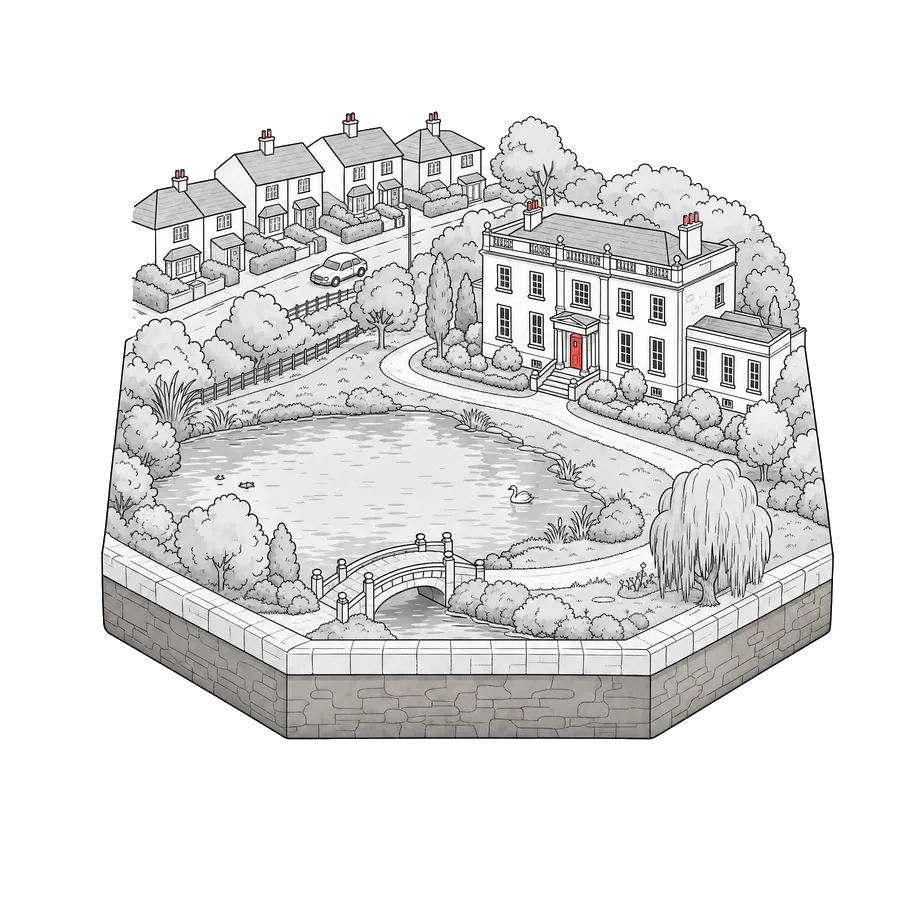
8.4% of 2,111 sales agreed
Valentines Mansion and its park
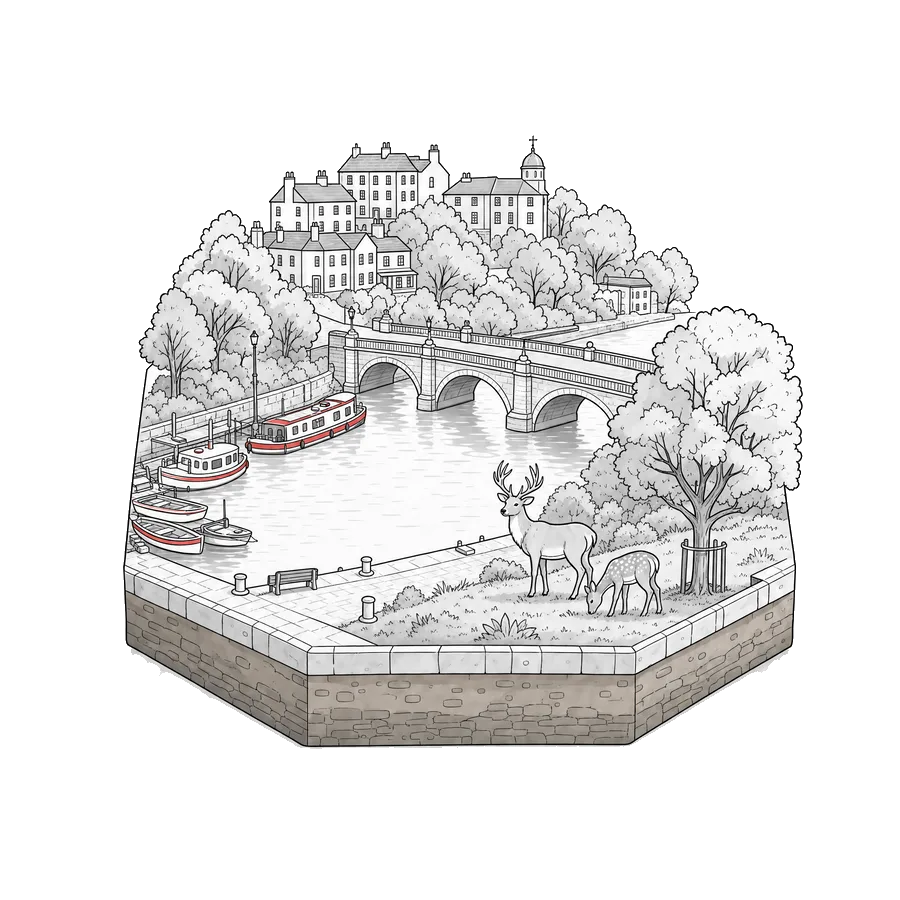
Chase Buchanan
17.9% of 1,780 sales agreed
Richmond Bridge and the Thames
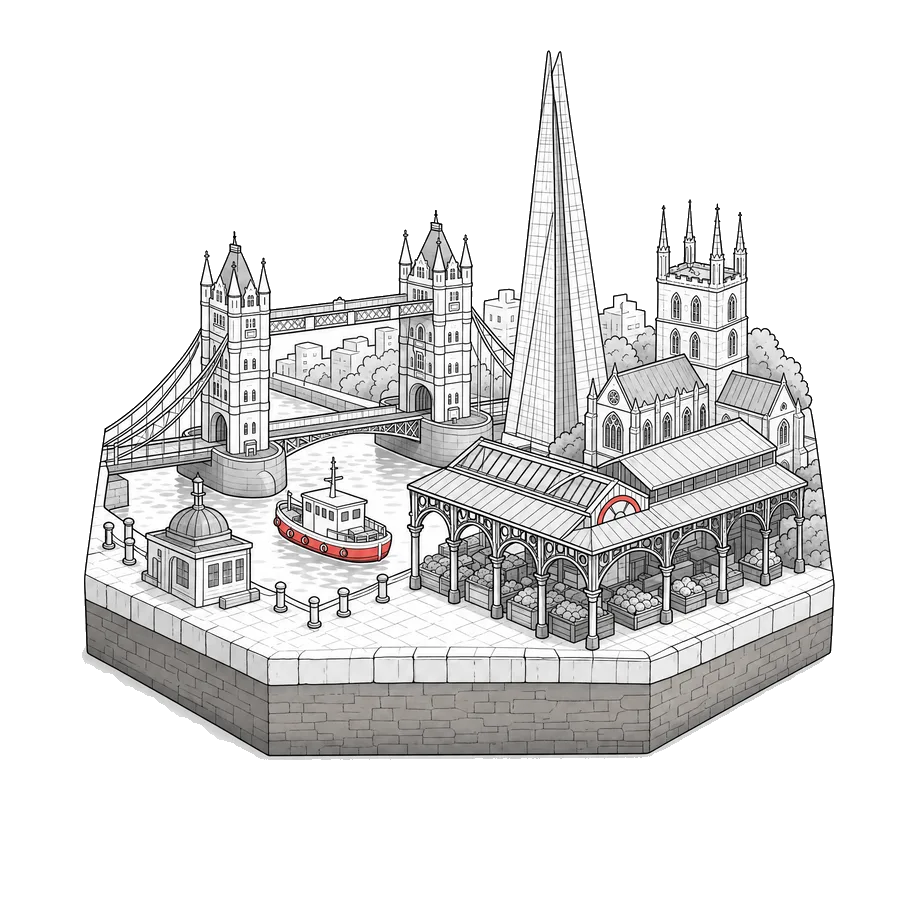
Acorn
14.1% of 2,071 sales agreed
The Shard and Borough Market
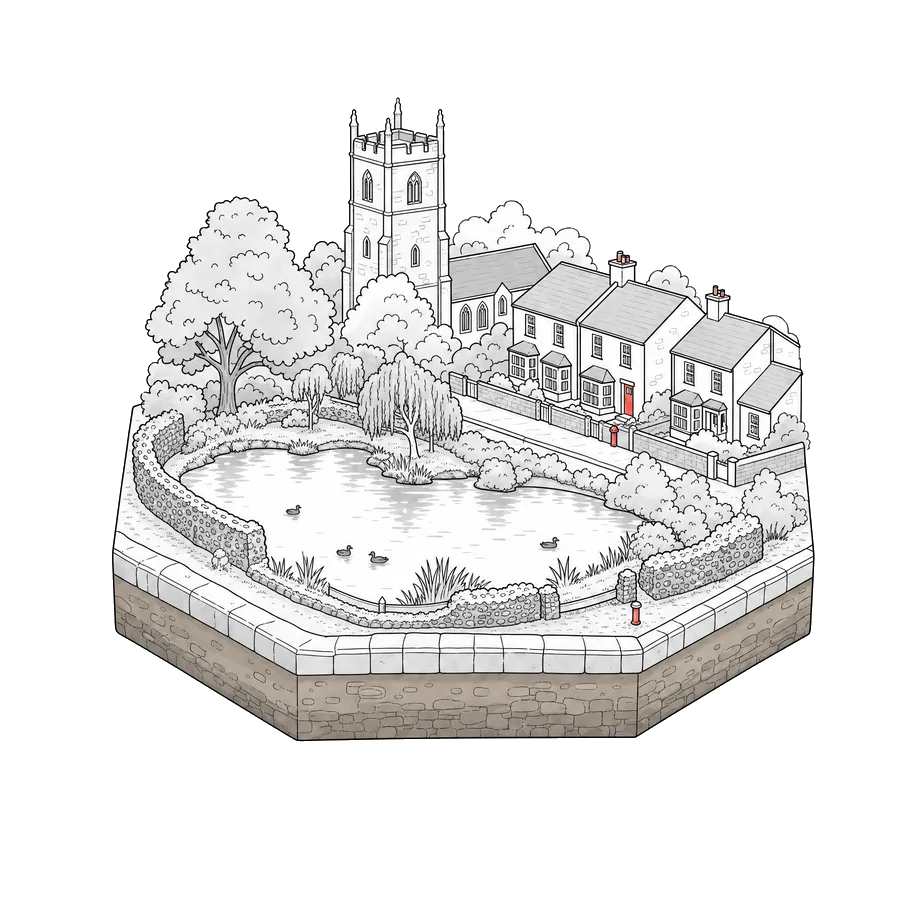
Paul Graham
9.8% of 2,079 sales agreed
Carshalton ponds and church
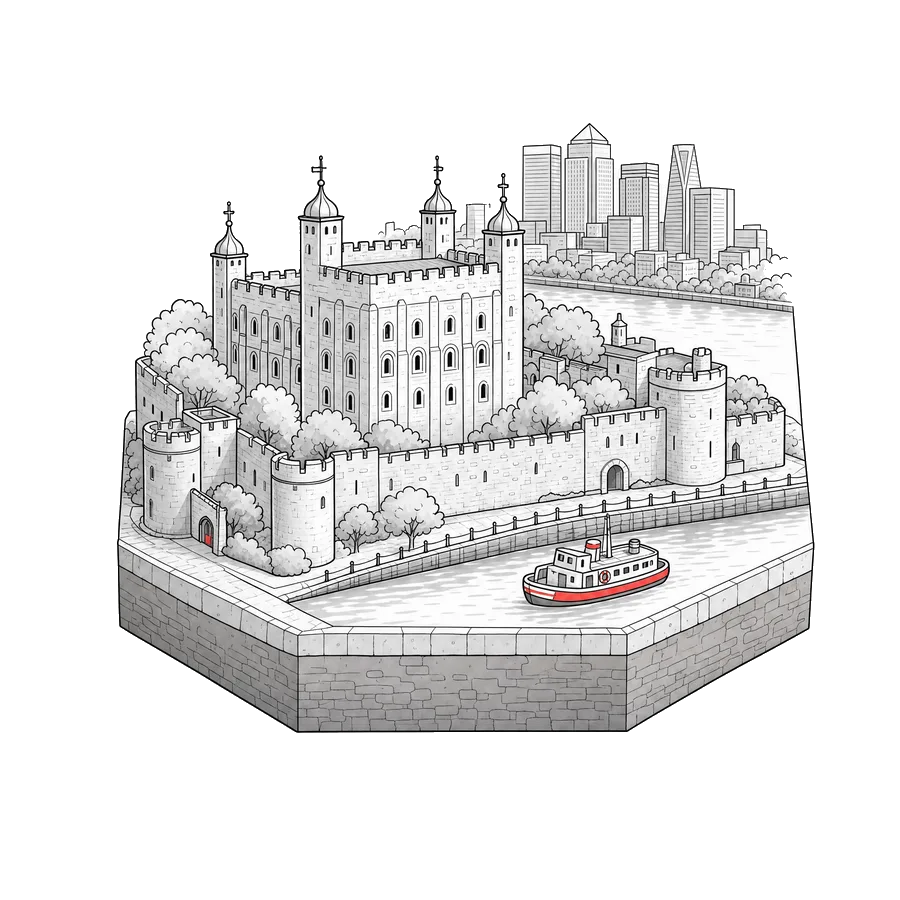
Foxtons
10.4% of 1,759 sales agreed
The Tower of London and Canary Wharf
The Stow Brothers
22.5% of 2,769 sales agreed
The William Morris Gallery, Walthamstow
Kinleigh Folkard & Hayward
20.6% of 2,765 sales agreed
Battersea Power Station's chimneys
Foxtons
10.1% of 1,271 sales agreed
Big Ben and Westminster Abbey
Market share
Tick postcode districts in or out. The table adds up each agency's sales agreed in the districts you pick.
65,117 sales agreed in 242 postcode districts, from 9 November 2025 to 8 November 2026
No sales agreed in the districts ticked. Tick more postcode districts to see who sells there.
Sales agreed shows who's busy. It doesn't show who's best for your home.
That's what Homemove shows you, for every London agency with enough sales to judge. Free.
Unlock freeSales agreed in the chosen districts, rolling three-month total, Nov 24 to Oct 26.
| Quarter to | Kinleigh Folkard & Hayward | Winkworth | Foxtons | Haart | Bairstow Eves |
|---|---|---|---|---|---|
| Jan 25 | 447 | 292 | 244 | 269 | 235 |
| Apr 25 | 560 | 417 | 378 | 269 | 232 |
| Jul 25 | 1311 | 373 | 317 | 320 | 247 |
| Oct 25 | 588 | 324 | 248 | 289 | 220 |
| Jan 26 | 648 | 371 | 286 | 250 | 248 |
| Apr 26 | 745 | 485 | 432 | 292 | 281 |
| Jul 26 | 823 | 561 | 746 | 332 | 318 |
| Oct 26 | 833 | 586 | 483 | 340 | 381 |
Sales agreed from 9 November 2025 to 8 November 2026 by each trading brand, every office added together, from home.co.uk’s own listing tracking. The arrow compares each share with the 12 months before. No addresses are used.
The range
The best and worst results among London agencies with 20 or more sales agreed from 9 November 2025 to 8 November 2026. The middle mark is the typical agency.
typical days from listing to sale agreed, across 486 agencies
of the first asking price, at Land Registry, across 202 agencies
of each agency's listings had a price cut, across 486 agencies
Which agent is the fastest? Which gets closest to the asking price? See every London agent's own figures side by side.
See them in your free dashboardWhose patch is it?
The agency with the most sales agreed in each London postcode district from 9 November 2025 to 8 November 2026, counted from tracked listings.
Covers Croydon, Shirley and Addiscombe. One ranking for the whole district, not each area.
Streets Ahead
8.9% of 1,331 sales agreed in CR0
Next: Barnard Marcus, 7.1%
Tower Bridge and the Elizabeth Tower
Covers Walthamstow and Lloyd Park. One ranking for the whole district, not each area.
Central
30.9% of 1,215 sales agreed in E17
Next: The Stow Brothers, 27.2%
Tower Bridge and the Elizabeth Tower
Covers Wimbledon, Colliers Wood and Merton Park. One ranking for the whole district, not each area.
Kinleigh Folkard & Hayward
18% of 782 sales agreed in SW19
Next: Ellisons, 17%
Tower Bridge and the Elizabeth Tower
Covers Beckenham, Park Langley and Langley Waterside. One ranking for the whole district, not each area.
Kinleigh Folkard & Hayward
18.9% of 758 sales agreed in BR3
Next: Proctors, 11.6%
Tower Bridge and the Elizabeth Tower
Covers South Croydon, Sanderstead and Selsdon. One ranking for the whole district, not each area.
Hubbard Torlot
12.1% of 711 sales agreed in CR2
Next: Pollard Machin, 9.3%
Tower Bridge and the Elizabeth Tower
Covers Ruislip and Eastcote. One ranking for the whole district, not each area.
Gibbs Gillespie
22.8% of 675 sales agreed in HA4
Next: Coopers, 22.2%
Tower Bridge and the Elizabeth Tower
Sales agreed from 9 November 2025 to 8 November 2026, every office of an agency added together, from home.co.uk’s own listing tracking. Pick districts in the table above to compare them all.
The 48 busiest of 1,475
Most sales agreed first, from 9 November 2025 to 8 November 2026, with every office of an agency added together. The order comes from the listings, never from who pays us.

47 offices selling in London
3,064 sales agreed
Albermarle House Albemarle Road, BR3 5HZ 157 sales
Time to sell Price achieved Price cuts1 Leigham Court Road, SW16 2ND 146 sales
Time to sell Price achieved Price cuts58-60 Tooting High Street, SW17 0RN 140 sales
Time to sell Price achieved Price cuts124 Balham High Road, SW12 9AA 125 sales
Time to sell Price achieved Price cuts517-519 Garratt Lane, SW18 4SW 122 sales
Time to sell Price achieved Price cuts44 Abbeville Road, SW4 9NF 112 sales
Time to sell Price achieved Price cuts49 Wimbledon Hill Road, SW19 7QW 108 sales
Time to sell Price achieved Price cuts322 Brockley Road, SE4 2BT 98 sales
Time to sell Price achieved Price cuts49 High Street, BR7 5AF 97 sales
Time to sell Price achieved Price cuts1 High Street, BR1 1LF 88 sales
Time to sell Price achieved Price cuts313 - 315 Kirkdale, SE26 4QB 86 sales
Time to sell Price achieved Price cuts48 Peckham Rye, SE15 4JR 82 sales
Time to sell Price achieved Price cuts292-294 Kennington Road, SE11 4LD 79 sales
Time to sell Price achieved Price cuts180 King Street, W6 0RA 73 sales
Time to sell Price achieved Price cuts76 High Street, BR4 0NH 71 sales
Time to sell Price achieved Price cuts767-769 High Road, N12 8JY 69 sales
Time to sell Price achieved Price cuts113 Rosendale Road, SE21 8EZ 69 sales
Time to sell Price achieved Price cuts206 Muswell Hill Broadway, N10 3SA 67 sales
Time to sell Price achieved Price cuts15-17 Westow Hill, SE19 1TQ 67 sales
Time to sell Price achieved Price cuts1 Putney Hill, SW15 6BA 67 sales
Time to sell Price achieved Price cuts251 Wimbledon Park Road, SW19 6NW 65 sales
Time to sell Price achieved Price cuts145 High Street, W3 6LP 62 sales
Time to sell Price achieved Price cuts199a West End Lane, NW6 2LJ 60 sales
Time to sell Price achieved Price cuts25-27 Montpelier Vale, SE3 0TJ 60 sales
Time to sell Price achieved Price cuts242 Battersea Park Road, SW11 3BP 58 sales
Time to sell Price achieved Price cuts30 The Pavement, SW4 0JE 57 sales
Time to sell Price achieved Price cuts36-37 Topsfield Parade, N8 8PT 55 sales
Time to sell Price achieved Price cutsMontreal House, Surrey Quays Road, SE16 7AQ 55 sales
Time to sell Price achieved Price cuts298 Upper Street, N1 2TU 54 sales
Time to sell Price achieved Price cuts1 Burnt Ash Hill, SE12 0AA 49 sales
Time to sell Price achieved Price cuts1A Station Buildings, SW20 8NE 49 sales
Time to sell Price achieved Price cuts4 Station Buildings, BR2 7EN 47 sales
Time to sell Price achieved Price cuts39 Dulwich Village, SE21 7BN 47 sales
Time to sell Price achieved Price cuts29 Effie Road, SW6 1EN 47 sales
Time to sell Price achieved Price cuts58 Highgate High Street, N6 5HX 45 sales
Time to sell Price achieved Price cuts107-109 Lordship Lane, SE22 8HU 44 sales
Time to sell Price achieved Price cuts81-83 Lower Richmond Road, SW15 1EU 43 sales
Time to sell Price achieved Price cuts108 Northcote Road, SW11 6QP 41 sales
Time to sell Price achieved Price cuts133 Rushey Green, SE6 4AA 34 sales
Time to sell Price achieved Price cuts49 Salusbury Road, NW6 6NJ 30 sales
Time to sell Price achieved Price cuts163-165 Chiswick High Road, W4 2DT 26 sales
Time to sell Price achieved Price cuts41-47 Barrow Hill Road, NW8 7AH 23 sales
Time to sell Price achieved Price cuts186 Queensway, W2 6LY 23 sales
Time to sell Price achieved Price cuts132-136 St. John Street, EC1V 4JT 21 sales
Time to sell Price achieved Price cuts44-48 Borough High Street, SE1 1XW 20 sales
Time to sell Price achieved Price cuts38 Englands Lane, NW3 4UE 13 sales
Time to sell Price achieved Price cuts136 Baker Street, W1U 6UD 13 sales
Time to sell Price achieved Price cuts
53 offices selling in London
2,017 sales agreed
Takes valuations through Homemove10-11 Grand Parade, N4 1JX 158 sales
Time to sell Price achieved Price cuts5 Blackheath Village, SE3 9LA 104 sales
Time to sell Price achieved Price cuts17 Upper Tooting Road, SW17 7TS 101 sales
Time to sell Price achieved Price cuts46-50 Streatham Hill, SW2 4RD 99 sales
Time to sell Price achieved Price cuts141 High Street, BR3 1BX 95 sales
Time to sell Price achieved Price cuts236 Railton Road, SE24 0JT 95 sales
Time to sell Price achieved Price cuts106 Highbury Park, N5 2XE 88 sales
Time to sell Price achieved Price cuts299 Kennington Road, SE11 4QE 88 sales
Time to sell Price achieved Price cuts393 Green Lanes, N13 4JG 73 sales
Time to sell Price achieved Price cuts40 New Kings Road, SW6 4ST 66 sales
Time to sell Price achieved Price cuts45-47 Station Way, SM3 8SD 64 sales
Time to sell Price achieved Price cuts97 Lordship Lane, SE22 8HU 59 sales
Time to sell Price achieved Price cuts499 Kingsbury Road, NW9 9ED 57 sales
Time to sell Price achieved Price cuts279 - 283 Greenwich High Road, SE10 8NB 55 sales
Time to sell Price achieved Price cuts157 New Cross Road, SE14 5DG 54 sales
Time to sell Price achieved Price cuts9 London Road, SE23 3TW 51 sales
Time to sell Price achieved Price cuts306 Kentish Town Road, NW5 2TH 49 sales
Time to sell Price achieved Price cuts144 Stoke Newington Church Street, N16 0JU 45 sales
Time to sell Price achieved Price cuts35 High Street, EN5 5UW 41 sales
Time to sell Price achieved Price cuts364 Regents Park Road, N3 2LJ 40 sales
Time to sell Price achieved Price cuts103/104 St. Johns Wood Terrace, NW8 6PL 40 sales
Time to sell Price achieved Price cuts211-213 Sutherland Avenue, W9 1RU 40 sales
Time to sell Price achieved Price cuts17 Lower Clapton Road, E5 0NS 39 sales
Time to sell Price achieved Price cuts184 Brick Lane, E1 6SA 33 sales
Time to sell Price achieved Price cuts33 Brabham Court, KT4 8EG 33 sales
Time to sell Price achieved Price cuts65 Upper Street, N1 0NY 32 sales
Time to sell Price achieved Price cuts97 Uxbridge Road, W12 8NL 28 sales
Time to sell Price achieved Price cuts28 Knights Hill, SE27 0HY 26 sales
Time to sell Price achieved Price cuts10a The Polygon, SW4 0JG 23 sales
Time to sell Price achieved Price cuts66 Exmouth Market, EC1R 4QP 22 sales
Time to sell Price achieved Price cuts5-6 Station Buildings, W5 3NU 21 sales
Time to sell Price achieved Price cuts49 Brent Street, NW4 2EA 19 sales
Time to sell Price achieved Price cuts178 Westbourne Grove, W11 2RH 17 sales
Time to sell Price achieved Price cuts429 Roman Road, E3 5LX 15 sales
Time to sell Price achieved Price cuts129 Shepherds Bush Road, W6 7LP 15 sales
Time to sell Price achieved Price cuts36 High Street, N6 5JG 13 sales
Time to sell Price achieved Price cuts891 Finchley Road, NW11 8RR 13 sales
Time to sell Price achieved Price cuts118 Kensington Church Street, W8 4BH 12 sales
Time to sell Price achieved Price cuts55 New Oxford Street, WC1A 1BS 12 sales
Time to sell Price achieved Price cuts142 West End Lane, NW6 1SD 11 sales
Time to sell Price achieved Price cuts269 Chiswick High Road, W4 4PU 9 sales
Time to sell Price achieved Price cuts196 Upper Richmond Road, SW15 2SH 8 sales
Time to sell Price achieved Price cuts31 Belgrave Road, SW1V 1RB 8 sales
Time to sell Price achieved Price cuts289 Brompton Road, SW3 2DY 8 sales
Time to sell Price achieved Price cuts100 High Street, SM7 2NN 7 sales
Time to sell Price achieved Price cuts23 Leinster Terrace, W2 3ET 7 sales
Time to sell Price achieved Price cuts161 Haverstock Hill, NW3 4QT 6 sales
Time to sell Price achieved Price cuts123a Gloucester Road, SW7 4TE 6 sales
Time to sell Price achieved Price cuts2 Barnes High Street, SW13 9LB 5 sales
Time to sell Price achieved Price cutsUnit 2 Bridge House Chamberlayne Road, NW10 3NR 3 sales
Time to sell Price achieved Price cuts241 Wimbledon Park Road, SW18 5RJ 2 sales
Time to sell Price achieved Price cuts7 Central Parade, HA1 2TW 1 sale
Time to sell Price achieved Price cuts141 Ladbroke Grove, W10 6HJ 1 sale
Time to sell Price achieved Price cuts
58 offices selling in London
1,954 sales agreed
Unit 2, E14 5NN 130 sales
Time to sell Price achieved Price cuts355 Upper Street, N1 0PD 121 sales
Time to sell Price achieved Price cuts225a Chiswick High Road, W4 2DW 79 sales
Time to sell Price achieved Price cuts86 - 90 Curtain Rd, EC2A 3AA 74 sales
Time to sell Price achieved Price cuts1-5 Wandsworth Road, SW8 2LN 62 sales
Time to sell Price achieved Price cuts73-79 Balham High Road, SW12 9AP 56 sales
Time to sell Price achieved Price cuts178 High Street, KT3 4ES 48 sales
Time to sell Price achieved Price cuts326-328 Creek Road, SE10 9SW 47 sales
Time to sell Price achieved Price cuts506 - 508 Brixton Road, SW9 8EN 46 sales
Time to sell Price achieved Price cuts634-636 Mile End Road, E3 4PH 45 sales
Time to sell Price achieved Price cuts9 The Grove, E15 1EL 42 sales
Time to sell Price achieved Price cuts451-453 High Road, HA9 7AF 42 sales
Time to sell Price achieved Price cuts27 - 31 Blandford Street, W1U 3DN 42 sales
Time to sell Price achieved Price cuts14 Major Draper Street, SE18 6GD 41 sales
Time to sell Price achieved Price cuts166 Vauxhall Bridge Road, SW1V 2RA 40 sales
Time to sell Price achieved Price cuts120 Parkway, NW1 7AN 39 sales
Time to sell Price achieved Price cuts9 Lee Road, SE3 9RQ 39 sales
Time to sell Price achieved Price cuts218-220 Rye Lane, SE15 4NL 38 sales
Time to sell Price achieved Price cuts62 Tooting High Street, SW17 0RN 38 sales
Time to sell Price achieved Price cuts168 Lavender Hill, SW11 5TG 37 sales
Time to sell Price achieved Price cuts1354 London Road, SW16 4DA 36 sales
Time to sell Price achieved Price cutsThe Pavilion, 4 Walworth Road, SE1 6EB 34 sales
Time to sell Price achieved Price cuts183-185 Hoe Street, E17 3AP 33 sales
Time to sell Price achieved Price cuts2-6 Station Parade, NW2 4NH 33 sales
Time to sell Price achieved Price cuts26 Westow Hill, SE19 1TQ 33 sales
Time to sell Price achieved Price cuts239 Old Brompton Road, SW5 9HP 33 sales
Time to sell Price achieved Price cuts30 Clifton Road, W9 1ST 33 sales
Time to sell Price achieved Price cuts175 Putney High Street, SW15 1RT 31 sales
Time to sell Price achieved Price cuts321 Station Road, HA1 2AA 30 sales
Time to sell Price achieved Price cuts566 Chiswick High Road, W4 5BE 30 sales
Time to sell Price achieved Price cuts54 The Mall, W5 3NE 30 sales
Time to sell Price achieved Price cuts28-30 Stoke Newington Church Street, N16 0LU 28 sales
Time to sell Price achieved Price cuts94 Borough High Street, SE1 1LL 28 sales
Time to sell Price achieved Price cuts90 Notting Hill Gate, W11 3HP 27 sales
Time to sell Price achieved Price cuts156-158 High Road, N22 6EB 23 sales
Time to sell Price achieved Price cuts1117 Finchley Road, NW11 0QB 23 sales
Time to sell Price achieved Price cuts55 Wimbledon Hill Road, SW19 7QW 22 sales
Time to sell Price achieved Price cuts1 East Street, BR1 1QE 21 sales
Time to sell Price achieved Price cuts47 Heath Street, NW3 6UA 21 sales
Time to sell Price achieved Price cuts82 Streatham High Road, SW16 1BS 21 sales
Time to sell Price achieved Price cuts82 Kings Road, SW3 4TZ 21 sales
Time to sell Price achieved Price cuts33-35 Bridge Street, HA5 3HR 20 sales
Time to sell Price achieved Price cutsWapping High Street, London, E1W 2YN 19 sales
Time to sell Price achieved Price cuts3-5 Crouch End Hill, N8 8DH 19 sales
Time to sell Price achieved Price cuts94 Old Brompton Road, SW7 3RD 19 sales
Time to sell Price achieved Price cuts302-304 Mare Street, E8 1HA 18 sales
Time to sell Price achieved Price cuts40 Church Road, HA7 4AH 18 sales
Time to sell Price achieved Price cuts29-35 Lordship Lane, SE22 8EW 18 sales
Time to sell Price achieved Price cuts55 Fulham Broadway, SW6 1AE 18 sales
Time to sell Price achieved Price cuts811 High Road, N12 8JT 16 sales
Time to sell Price achieved Price cuts2 High Street, CR0 1YA 15 sales
Time to sell Price achieved Price cuts30-32 Shepherds Bush Green, W12 8PH 15 sales
Time to sell Price achieved Price cuts137 - 144 High Holborn, WC1V 6PL 15 sales
Time to sell Price achieved Price cutsCivic Centre, Lampton Road, TW3 4DN 13 sales
Time to sell Price achieved Price cuts98 St. Johns Wood Terrace, NW8 6PL 11 sales
Time to sell Price achieved Price cuts50 - 54 Clerkenwell Road, EC1M 5PS 10 sales
Time to sell Price achieved Price cuts20-24 York Street, TW1 3LD 8 sales
Time to sell Price achieved Price cuts28-30 Castle St, KT1 1SS 5 sales
Time to sell Price achieved Price cuts
28 offices selling in London
1,238 sales agreed
142 The Grove, E15 1NS 141 sales
Time to sell Price achieved Price cuts204 High Street North, E6 2JA 107 sales
Time to sell Price achieved Price cuts20 Collier Row Road, RM5 3NX 93 sales
Time to sell Price achieved Price cuts252 Heathway, RM10 8QS 82 sales
Time to sell Price achieved Price cuts74 Station Parade, IG11 8EA 74 sales
Time to sell Price achieved Price cuts16 North Street, RM11 1RH 67 sales
Time to sell Price achieved Price cuts132 South Street, RM1 1TE 66 sales
Time to sell Price achieved Price cuts198 Lavender Hill, SW11 1JA 64 sales
Time to sell Price achieved Price cuts31 High Street, IG6 2AD 55 sales
Time to sell Price achieved Price cuts171 173 Hoe Street, E17 3AL 47 sales
Time to sell Price achieved Price cuts1449 London Road, SW16 4AQ 44 sales
Time to sell Price achieved Price cuts411-413 High Road, IG8 0XG 40 sales
Time to sell Price achieved Price cuts182 184 Addington Road, CR2 8LB 36 sales
Time to sell Price achieved Price cuts38 The Broadway, RM12 4RN 35 sales
Time to sell Price achieved Price cuts33 Upminster Road South, RM13 9YS 35 sales
Time to sell Price achieved Price cuts9 - 10 Angel Corner Parade, N18 2QH 32 sales
Time to sell Price achieved Price cuts5 Chase Side, N14 5BP 31 sales
Time to sell Price achieved Price cuts658 High Road Leytonstone, E11 3AA 27 sales
Time to sell Price achieved Price cuts293a Wickham Road, CR0 8TJ 25 sales
Time to sell Price achieved Price cuts3 Station Approach, CR8 5JD 22 sales
Time to sell Price achieved Price cuts117 South End, CR0 1BJ 20 sales
Time to sell Price achieved Price cuts68 High Street, E11 2RJ 19 sales
Time to sell Price achieved Price cuts829 High Road, N12 8PR 19 sales
Time to sell Price achieved Price cuts2-3 The Exchange Purley Road, CR8 2HA 18 sales
Time to sell Price achieved Price cuts59 Southbury Road, EN1 1PJ 18 sales
Time to sell Price achieved Price cuts22 Norfolk House, CR0 1LG 14 sales
Time to sell Price achieved Price cuts488 Roman Road, E3 5LU 5 sales
Time to sell Price achieved Price cuts9 - 11, CR3 6LB 2 sales
Time to sell Price achieved Price cuts
26 offices selling in London
1,218 sales agreed
covering Grantham 146 sales
Time to sell Price achieved Price cuts153/159, RM1 1PL 102 sales
Time to sell Price achieved Price cuts184-188 Cranbrook Road, IG1 4LU 96 sales
Time to sell Price achieved Price cuts76 Brigstock Road, CR7 7JA 82 sales
Time to sell Price achieved Price cuts49a Station Road, RM3 0BS 82 sales
Time to sell Price achieved Price cuts1-3a Reede Road, RM10 8DP 79 sales
Time to sell Price achieved Price cuts462 Uxbridge Road, UB4 0SD 72 sales
Time to sell Price achieved Price cuts54 High Street, IG6 2DQ 64 sales
Time to sell Price achieved Price cuts306-308 High Street, BR6 0NF 54 sales
Time to sell Price achieved Price cuts143-145 Hoe Street, E17 3AL 53 sales
Time to sell Price achieved Price cuts184 Main Road, TN16 3BB 52 sales
Time to sell Price achieved Price cuts13 North Street, RM11 1RL 43 sales
Time to sell Price achieved Price cuts121 South End, CR0 1BJ 36 sales
Time to sell Price achieved Price cuts219 High Street North, E6 1JG 34 sales
Time to sell Price achieved Price cuts32-34 High Street, SM1 1HF 26 sales
Time to sell Price achieved Price cuts31 Bridge Road, HA9 9AB 25 sales
Time to sell Price achieved Price cuts55 Westow Hill, SE19 1TS 25 sales
Time to sell Price achieved Price cuts53 The Broadway, UB6 9PP 25 sales
Time to sell Price achieved Price cuts103 - 105, SE22 8HU 24 sales
Time to sell Price achieved Price cuts4a Leytonstone Road, E15 1SE 23 sales
Time to sell Price achieved Price cuts49/50 Church Lane, E11 1HE 19 sales
Time to sell Price achieved Price cuts141/143 George Lane, E18 1AN 18 sales
Time to sell Price achieved Price cuts213 Streatfield Road, HA3 9DA 18 sales
Time to sell Price achieved Price cuts35-37 Chase Side, N14 5BP 18 sales
Time to sell Price achieved Price cuts5 Spital Street, DA1 2DJ 1 sale
Time to sell Price achieved Price cuts38 The Town, EN2 6LA 1 sale
Time to sell Price achieved Price cuts
37 offices selling in London
1,166 sales agreed
57 Nightingale Lane, SW12 8ST 86 sales
Time to sell Price achieved Price cuts94 Upper Street, N1 0NP 74 sales
Time to sell Price achieved Price cuts12 Huguenot Place, SW18 2EW 74 sales
Time to sell Price achieved Price cuts198 Upper Richmond Road, SW15 2SH 64 sales
Time to sell Price achieved Price cuts99 Northcote Road, SW11 6PL 62 sales
Time to sell Price achieved Price cuts3 The Green, W5 5DA 58 sales
Time to sell Price achieved Price cuts305 Kingsland Road, E8 4EG 53 sales
Time to sell Price achieved Price cuts40-42 Hill Rise, TW10 6UA 49 sales
Time to sell Price achieved Price cuts191 New Kings Road, SW6 4SW 46 sales
Time to sell Price achieved Price cuts145 Kensington Church Street, W8 4BN 45 sales
Time to sell Price achieved Price cuts1 High Street Wimbledon, SW19 5DX 44 sales
Time to sell Price achieved Price cuts92 Turnham Green Terrace, W4 1QN 44 sales
Time to sell Price achieved Price cuts81 Lauriston Road, E9 7HJ 34 sales
Time to sell Price achieved Price cuts52 Barnes High Street, SW13 9LN 34 sales
Time to sell Price achieved Price cuts139 Sloane Street, SW1X 9AY 34 sales
Time to sell Price achieved Price cuts236 Battersea Park Road, SW11 4ND 33 sales
Time to sell Price achieved Price cuts196-200 Fulham Road, SW10 9PN 30 sales
Time to sell Price achieved Price cuts166 Shepherd's Bush Road, W6 7PB 28 sales
Time to sell Price achieved Price cuts7 Perrins Court, NW3 1QS 27 sales
Time to sell Price achieved Price cuts22 Devonshire Street, W1G 6PF 27 sales
Time to sell Price achieved Price cuts57 Buckingham Gate, SW1E 6AJ 26 sales
Time to sell Price achieved Price cutsExecution Dock, 80 Wapping High Street, E1W 2NE 25 sales
Time to sell Price achieved Price cuts48 Great Eastern Street, EC2A 3EP 21 sales
Time to sell Price achieved Price cuts122-124 St. John Street, EC1V 4JS 19 sales
Time to sell Price achieved Price cuts79 Regents Park Road, NW1 8UY 18 sales
Time to sell Price achieved Price cuts36 North Audley Street, W1K 6ZJ 18 sales
Time to sell Price achieved Price cuts168 Westbourne Grove, W11 2RW 17 sales
Time to sell Price achieved Price cuts188 Brompton Road, SW3 1HQ 15 sales
Time to sell Price achieved Price cuts20 Canada Square, E14 5NN 14 sales
Time to sell Price achieved Price cuts15 St. Johns Wood High Street, NW8 7NG 14 sales
Time to sell Price achieved Price cuts237 Earls Court Road, SW5 9AH 11 sales
Time to sell Price achieved Price cuts423 Fulham Palace Road, SW6 6SX 6 sales
Time to sell Price achieved Price cuts28 High Street, TW11 8EW 5 sales
Time to sell Price achieved Price cuts74 High Street, TN13 1JR 4 sales
Time to sell Price achieved Price cuts11 Church Street, WD3 1BX 4 sales
Time to sell Price achieved Price cuts1a Smarts Lane, IG10 4BU 2 sales
Time to sell Price achieved Price cuts55 High Street, KT10 9SH 1 sale
Time to sell Price achieved Price cutsSee how fast each one sells. Time to sell and price achieved for every London agent with enough sales, free with an account.
Unlock free
33 offices selling in London
1,081 sales agreed
50 Lower Addiscombe Road, CR0 6AA 64 sales
Time to sell Price achieved Price cuts1285 High Road, N20 9HS 64 sales
Time to sell Price achieved Price cuts4/5 Brigstock, CR7 7HW 63 sales
Time to sell Price achieved Price cuts46-48 High Street, KT3 4EZ 60 sales
Time to sell Price achieved Price cuts9 Station Parade, SM2 5AD 57 sales
Time to sell Price achieved Price cuts17 Selsdon Road, CR2 6PY 56 sales
Time to sell Price achieved Price cuts315 Kennington Road, SE11 4QE 52 sales
Time to sell Price achieved Price cuts67 Central Road, KT4 8EB 45 sales
Time to sell Price achieved Price cuts55 The Mall, W5 3TA 45 sales
Time to sell Price achieved Price cuts1 Langdale Parade, CR4 2PF 41 sales
Time to sell Price achieved Price cuts814 High Road, N12 9QY 39 sales
Time to sell Price achieved Price cuts152 Rye Lane, SE15 4NB 36 sales
Time to sell Price achieved Price cuts4 Parkfield Parade, TW13 4HJ 36 sales
Time to sell Price achieved Price cutsCannon Court Manor Road, Wallington, SM6 0AP 35 sales
Time to sell Price achieved Price cutsMorden 35 sales
Time to sell Price achieved Price cuts245 Wimbledon Park Road, SW18 5RJ 32 sales
Time to sell Price achieved Price cuts120 Mitcham Lane, SW16 6NS 31 sales
Time to sell Price achieved Price cuts85 Rectory Grove, SW4 0DR 31 sales
Time to sell Price achieved Price cuts262 Muswell Hill Broadway, N10 3SH 29 sales
Time to sell Price achieved Price cuts235 Lavender Hill, SW11 1JW 26 sales
Time to sell Price achieved Price cuts525 Garratt Lane, SW18 4SR 26 sales
Time to sell Price achieved Price cuts155 Upper Richmond Road, SW15 2TX 25 sales
Time to sell Price achieved Price cuts543 High Road, N17 6SB 23 sales
Time to sell Price achieved Price cuts87-89 Chiswick High Road, W4 2EF 22 sales
Time to sell Price achieved Price cuts12A Station Parade, CR2 0PL 21 sales
Time to sell Price achieved Price cuts248 Upper Tooting Road, SW17 7EX 21 sales
Time to sell Price achieved Price cuts66-68 Shepherds Bush Road, W6 7PH 21 sales
Time to sell Price achieved Price cuts371 Upper Richmond Road West, SW14 7NX 12 sales
Time to sell Price achieved Price cuts53 Endell Street, WC2H 9AJ 12 sales
Time to sell Price achieved Price cuts13 Sydenham Road, SE26 5EX 8 sales
Time to sell Price achieved Price cutsUnit 2, KT19 0DB 6 sales
Time to sell Price achieved Price cuts279 Old Brompton Road, SW5 9JA 6 sales
Time to sell Price achieved Price cuts5A Surbiton Parade, KT6 4RB 1 sale
Time to sell Price achieved Price cuts
5 offices selling in London
992 sales agreed
236 Hoe Street, E17 3AY 407 sales
Time to sell Price achieved Price cuts117a High Street Wanstead, E11 2RL 255 sales
Time to sell Price achieved Price cutsThe Avenue, London, E4 9LE 120 sales
Time to sell Price achieved Price cuts136 George Lane, E18 1AY 114 sales
Time to sell Price achieved Price cuts5 Amhurst Road, E8 1LL 96 sales
Time to sell Price achieved Price cuts
12 offices selling in London
939 sales agreed
303 - 305 Rayners Lane, HA5 5EH 153 sales
Time to sell Price achieved Price cuts1 Chapel Lane, HA5 1AA 106 sales
Time to sell Price achieved Price cuts48 Victoria Road, HA4 0AG 98 sales
Time to sell Price achieved Price cuts33 Church Road, HA7 4BP 97 sales
Time to sell Price achieved Price cuts172-174 High Street, HA4 8LJ 92 sales
Time to sell Price achieved Price cuts268 High Street, UB8 1LQ 92 sales
Time to sell Price achieved Price cuts65c Green Lane, HA6 3AD 74 sales
Time to sell Price achieved Price cuts132 Northfield Avenue, W13 9RT 63 sales
Time to sell Price achieved Price cutscovering Ickenham 62 sales
Time to sell Price achieved Price cuts1 Albert Terrace, W5 1RL 51 sales
Time to sell Price achieved Price cuts20 New Broadway, W5 2XA 33 sales
Time to sell Price achieved Price cuts26 Packhorse Road, SL9 7DA 18 sales
Time to sell Price achieved Price cuts
24 offices selling in London
825 sales agreed
352a Kings Road, SW3 5UU 76 sales
Time to sell Price achieved Price cuts321-322 Upper Street, N1 2XQ 69 sales
Time to sell Price achieved Price cuts203 New Kings Road, SW6 4SR 59 sales
Time to sell Price achieved Price cuts58 High Street Wimbledon, SW19 5EE 53 sales
Time to sell Price achieved Price cuts30 Churchill Place, E14 5RE 48 sales
Time to sell Price achieved Price cuts64 Turnham Green Terrace, W4 1QN 48 sales
Time to sell Price achieved Price cuts1C Calton Avenue, SE21 7DE 43 sales
Time to sell Price achieved Price cuts26 Bellevue Road, SW17 7EB 41 sales
Time to sell Price achieved Price cuts60c & 60F Salusbury Road, NW6 6NP 36 sales
Time to sell Price achieved Price cuts52-54 Sloane Avenue, SW3 3DD 36 sales
Time to sell Price achieved Price cuts23 Hill Street, TW9 1SX 36 sales
Time to sell Price achieved Price cuts52-56 Kensington Church Street, W8 4DB 36 sales
Time to sell Price achieved Price cuts58-62 Heath Street, NW3 1EN 35 sales
Time to sell Price achieved Price cuts294 Westbourne Grove, W11 2PS 33 sales
Time to sell Price achieved Price cuts5 - 7 Wellington Place, NW8 7PB 28 sales
Time to sell Price achieved Price cuts44 South Audley Street London, W1K 2PX 28 sales
Time to sell Price achieved Price cuts47 Lower Belgrave Street, SW1W 0LS 27 sales
Time to sell Price achieved Price cuts2C Englands Lane, NW3 4TG 25 sales
Time to sell Price achieved Price cutsUnit C1 Vista, SW11 8BY 23 sales
Time to sell Price achieved Price cutsUnit 49, W1U 8EW 20 sales
Time to sell Price achieved Price cutsForum St Paul's, 33 Gutter Lane, EC2V 8AS 10 sales
Time to sell Price achieved Price cuts55 Baker Street, W1U 8AN 6 sales
Time to sell Price achieved Price cuts1 Craven Terrace, W2 3QD 6 sales
Time to sell Price achieved Price cuts113-117 High Street, TN13 1UP 3 sales
Time to sell Price achieved Price cuts
29 offices selling in London
816 sales agreed
Takes valuations through Homemove327 - 329 Upper Street, N1 2XQ 113 sales
Time to sell Price achieved Price cuts99-101 Parkway, NW1 7PP 50 sales
Time to sell Price achieved Price cuts153 Upper Richmond Road, SW15 2TX 49 sales
Time to sell Price achieved Price cuts11 Huguenot Place, SW18 2EN 46 sales
Time to sell Price achieved Price cuts105 Wilton Road, SW1V 1DZ 40 sales
Time to sell Price achieved Price cutsHarbour Island, 28 Harbour Exchange Square, E14 9GE 38 sales
Time to sell Price achieved Price cuts6 Battersea Rise, SW11 1ED 36 sales
Time to sell Price achieved Price cuts5th Floor East, NW1 2PL 33 sales
Time to sell Price achieved Price cuts654 Fulham Road, SW6 5RU 33 sales
Time to sell Price achieved Price cuts40 Connaught Street, W2 2AB 31 sales
Time to sell Price achieved Price cuts62-64 Battersea Bridge Road, SW11 3AG 27 sales
Time to sell Price achieved Price cuts31 Lowndes Street, SW1X 9HX 26 sales
Time to sell Price achieved Price cuts26 Clifton Road, W9 1SX 26 sales
Time to sell Price achieved Price cuts55-56 Hampstead High Street, NW3 1QH 24 sales
Time to sell Price achieved Price cuts30 Ledbury Road, W11 2AB 23 sales
Time to sell Price achieved Price cuts68-69 Barnes High Street, SW13 9LD 22 sales
Time to sell Price achieved Price cuts191 Munster Road, SW6 6BY 22 sales
Time to sell Price achieved Price cuts23A Friars Stile Road, TW10 6NH 22 sales
Time to sell Price achieved Price cutsEntrance on Sheen Lane, Ground Floor, SW14 8AG 21 sales
Time to sell Price achieved Price cuts44-48 Old Brompton Road, SW7 3DY 21 sales
Time to sell Price achieved Price cuts220 Tower Bridge Road, SE1 2UP 20 sales
Time to sell Price achieved Price cuts155 Chiswick High Road, W4 2DT 19 sales
Time to sell Price achieved Price cuts116 Kensington High Street, W8 7RW 17 sales
Time to sell Price achieved Price cuts78 New Kings Road, SW6 4LT 14 sales
Time to sell Price achieved Price cuts1 Royal Parade, TW9 3QD 14 sales
Time to sell Price achieved Price cuts105 St. John's Wood Terrace, NW8 6PL 11 sales
Time to sell Price achieved Price cuts196 Shaftesbury Avenue, WC2H 8JF 10 sales
Time to sell Price achieved Price cuts2 Plough Way, SE16 2EU 6 sales
Time to sell Price achieved Price cuts47 South Audley Street, W1K 2QA 2 sales
Time to sell Price achieved Price cuts
20 offices selling in London
796 sales agreed
31 Coldharbour Lane, UB3 3EB 131 sales
Time to sell Price achieved Price cuts41 High Street, EN5 5UW 85 sales
Time to sell Price achieved Price cuts29 Denmark Hill, SE5 8RS 79 sales
Time to sell Price achieved Price cuts284 High Road, N15 4AJ 57 sales
Time to sell Price achieved Price cuts99 Russell Lane, N20 0BA 55 sales
Time to sell Price achieved Price cuts19-21 Wilton Road, SE2 9RH 55 sales
Time to sell Price achieved Price cuts6 Tudor Parade, RM6 6PS 52 sales
Time to sell Price achieved Price cutsMabel House, 10a Dartmouth Road, SE23 3XU 48 sales
Time to sell Price achieved Price cuts272 Barking Road, E13 8HR 46 sales
Time to sell Price achieved Price cuts223 West End Lane, NW6 1XJ 43 sales
Time to sell Price achieved Price cuts94 Central Road, KT4 8HU 42 sales
Time to sell Price achieved Price cuts153 Rushey Green, SE6 4BD 30 sales
Time to sell Price achieved Price cuts92 High Street, SM5 3AE 23 sales
Time to sell Price achieved Price cuts6 Ferry Quays, TW8 0AT 23 sales
Time to sell Price achieved Price cuts6 Station Parade, HA3 8SB 9 sales
Time to sell Price achieved Price cuts110 Curtain Road, EC2A 3AH 7 sales
Time to sell Price achieved Price cuts219 High Street Bromley, BR1 1NY 6 sales
Time to sell Price achieved Price cutsCovering Sherborne 3 sales
Time to sell Price achieved Price cuts15 Victoria Road, DH8 5BQ 1 sale
Time to sell Price achieved Price cuts86 Camden Road, NW1 9EA 1 sale
Time to sell Price achieved Price cuts
114 St. Martin's Lane, WC2N 4BE
745 sales agreed
Takes valuations through Homemove
15 offices selling in London
736 sales agreed
30-32 Peckham Rye, SE15 4JR 103 sales
Time to sell Price achieved Price cuts27 Denmark Hill, SE5 8RS 83 sales
Time to sell Price achieved Price cuts128 Rushey Green, SE6 4HQ 74 sales
Time to sell Price achieved Price cuts325 Kennington Road, SE11 4QE 62 sales
Time to sell Price achieved Price cuts321 Baring Road, SE12 0DZ 53 sales
Time to sell Price achieved Price cuts29 Westow Street, SE19 3RW 50 sales
Time to sell Price achieved Price cuts409 Brockley Road, SE4 2PH 50 sales
Time to sell Price achieved Price cuts120 Bermondsey Street, SE1 3TX 49 sales
Time to sell Price achieved Price cuts153 Lewisham High Street, SE13 6AA 48 sales
Time to sell Price achieved Price cuts278-280 Kirkdale, SE26 4RS 47 sales
Time to sell Price achieved Price cuts98 Lordship Lane, SE22 8HF 35 sales
Time to sell Price achieved Price cuts58 London Road, SE23 3HF 35 sales
Time to sell Price achieved Price cuts9 St. Marks Road, BR2 9HG 33 sales
Time to sell Price achieved Price cuts75a Nuxley Road, DA17 5JN 12 sales
Time to sell Price achieved Price cuts2a Bellegrove Road, DA16 3PR 2 sales
Time to sell Price achieved Price cuts
9 offices selling in London
699 sales agreed
292 High Street, BR6 0NF 108 sales
Time to sell Price achieved Price cuts123-125 Plumstead Common Road, SE18 2UQ 107 sales
Time to sell Price achieved Price cuts256 Kirkdale, SE26 4NL 107 sales
Time to sell Price achieved Price cuts1 Wellington Parade, DA15 9NB 106 sales
Time to sell Price achieved Price cuts87 Rushey Green, SE6 4AF 92 sales
Time to sell Price achieved Price cuts27 Lewis Grove, SE13 6BG 84 sales
Time to sell Price achieved Price cuts2-4 Court Yard, SE9 5PZ 75 sales
Time to sell Price achieved Price cuts61 Nuxley Road, DA17 5JN 19 sales
Time to sell Price achieved Price cuts146 Welling High Street, DA16 1TJ 1 sale
Time to sell Price achieved Price cuts
8 offices selling in London
671 sales agreed
109 Hillingdon Hill, UB10 0JQ 199 sales
Time to sell Price achieved Price cuts126 - 128 High Street, HA4 8LL 112 sales
Time to sell Price achieved Price cuts1 Tavistock Road, UB7 7QT 76 sales
Time to sell Price achieved Price cuts27-29 Swakeleys Road, UB10 8DF 75 sales
Time to sell Price achieved Price cuts18 Bridge Street, HA5 3JF 74 sales
Time to sell Price achieved Price cuts71 Victoria Road, HA4 9BH 67 sales
Time to sell Price achieved Price cuts1 Vine Street, UB8 1QE 54 sales
Time to sell Price achieved Price cuts22 Cleveland Street, W1T 4JB 14 sales
Time to sell Price achieved Price cuts
9 offices selling in London
521 sales agreed
Pissarro House, 77a Westow Hill, SE19 1TX 97 sales
Time to sell Price achieved Price cuts2-4 London Road, SE23 3HF 76 sales
Time to sell Price achieved Price cuts14 Sydenham Road, SE26 5QW 72 sales
Time to sell Price achieved Price cuts117 Lordship Lane, SE22 8HU 60 sales
Time to sell Price achieved Price cuts91-93 Queens Road, SE15 2EZ 54 sales
Time to sell Price achieved Price cuts119 Dulwich Village, SE21 7BJ 53 sales
Time to sell Price achieved Price cuts437-439 Brockley Road, SE4 2PJ 39 sales
Time to sell Price achieved Price cuts24 Half Moon Lane, SE24 9HU 35 sales
Time to sell Price achieved Price cuts270 Norwood Road, SE27 9AJ 35 sales
Time to sell Price achieved Price cuts
7 offices selling in London
496 sales agreed
182 High Street, BR6 0JW 112 sales
Time to sell Price achieved Price cutsThe Old Municipal Buildings, 19 East Street, BR1 1QE 84 sales
Time to sell Price achieved Price cuts234 High Street, BR3 1EN 74 sales
Time to sell Price achieved Price cuts1 High Street, BR4 0LP 67 sales
Time to sell Price achieved Price cuts9 Princess Parade, BR6 8NP 64 sales
Time to sell Price achieved Price cuts3 High Street, BR7 5AB 52 sales
Time to sell Price achieved Price cuts134 Main Road, TN16 3BA 43 sales
Time to sell Price achieved Price cuts
4 offices selling in London
496 sales agreed
1 North Street, RM11 1RL 189 sales
Time to sell Price achieved Price cuts5-6 Station Chambers, RM1 2HU 145 sales
Time to sell Price achieved Price cuts63 Station Road, RM14 2SU 94 sales
Time to sell Price achieved Price cuts293 Heathway, RM9 5AQ 68 sales
Time to sell Price achieved Price cuts
Purplebricks, 146 Freston Road, W10 6TR
485 sales agreed

6 offices selling in London
482 sales agreed
34 Station Square, BR5 1NA 119 sales
Time to sell Price achieved Price cuts38 High Street, BR1 1EA 92 sales
Time to sell Price achieved Price cuts41 High Street, BR7 5AE 80 sales
Time to sell Price achieved Price cutsAlexandre House, 399, BR6 8NL 79 sales
Time to sell Price achieved Price cuts42 Well Hall Road, SE9 6SF 69 sales
Time to sell Price achieved Price cuts36 Montpelier Vale, SE3 0TA 43 sales
Time to sell Price achieved Price cuts
8 offices selling in London
481 sales agreed
1 Montpelier Vale, SE3 0TA 75 sales
Time to sell Price achieved Price cuts11 Stratheden Parade, SE3 7SX 67 sales
Time to sell Price achieved Price cuts78 Eltham High Street, SE9 1BX 61 sales
Time to sell Price achieved Price cuts119 Burnt Ash Road, SE12 8RA 60 sales
Time to sell Price achieved Price cuts140 Plumstead Common Road, SE18 2UL 60 sales
Time to sell Price achieved Price cuts11-15 Woolwich Road, SE10 0RA 59 sales
Time to sell Price achieved Price cuts93 Woolwich New Road, SE18 6EF 50 sales
Time to sell Price achieved Price cuts227 Greenwich High Road, SE10 8NB 49 sales
Time to sell Price achieved Price cuts
18 offices selling in London
467 sales agreed
127-129 Percy Road, TW2 6HT 56 sales
Time to sell Price achieved Price cuts40 Great Eastern Street, EC2A 3EP 45 sales
Time to sell Price achieved Price cuts539 Kingsland Road, E8 4AR 41 sales
Time to sell Price achieved Price cuts106 St. John Street, EC1M 4EH 37 sales
Time to sell Price achieved Price cuts63 Bermondsey Street, SE1 3XF 36 sales
Time to sell Price achieved Price cuts11 High Street, SE25 6EZ 36 sales
Time to sell Price achieved Price cuts440 Chiswick High Road, W4 5TT 32 sales
Time to sell Price achieved Price cutsRoom 1.54, CR0 2RD 31 sales
Time to sell Price achieved Price cuts167 Putney High Street, SW15 1RT 31 sales
Time to sell Price achieved Price cuts5-7 Streatleigh Parade, SW16 1EQ 31 sales
Time to sell Price achieved Price cuts53 Chatsworth Road, E5 0LH 20 sales
Time to sell Price achieved Price cuts91 Acre Lane, SW2 5TU 14 sales
Time to sell Price achieved Price cuts96 Three Colt Street, E14 8AP 12 sales
Time to sell Price achieved Price cuts25 London Road, TW1 3SX 12 sales
Time to sell Price achieved Price cuts95 High Street, CR7 8RY 10 sales
Time to sell Price achieved Price cuts2.08 Tintagel House, SE1 7TY 10 sales
Time to sell Price achieved Price cuts338 Mare Street, E8 1HA 9 sales
Time to sell Price achieved Price cuts15a Station Road, TW16 6SB 4 sales
Time to sell Price achieved Price cuts
3 offices selling in London
465 sales agreed
179 Hoe Street, E17 3AP 362 sales
Time to sell Price achieved Price cuts48 Church Lane, E11 1HE 80 sales
Time to sell Price achieved Price cuts28 The Avenue, E4 9LD 23 sales
Time to sell Price achieved Price cuts
12 offices selling in London
448 sales agreed
300 Muswell Hill Broadway, N10 2QR 61 sales
Time to sell Price achieved Price cuts45 The Broadway, N8 8DT 52 sales
Time to sell Price achieved Price cuts773 High Road, N12 8JY 47 sales
Time to sell Price achieved Price cuts1286 High Road, N20 9HH 46 sales
Time to sell Price achieved Price cuts21 The Green, N21 3NL 44 sales
Time to sell Price achieved Price cuts365 Regents Park Road, N3 1DE 40 sales
Time to sell Price achieved Price cuts66 / 68 High Road, N2 9PN 39 sales
Time to sell Price achieved Price cuts4 Exchanges Building, EN5 5SY 38 sales
Time to sell Price achieved Price cuts304 Kentish Town Road, NW5 2TH 33 sales
Time to sell Price achieved Price cuts109 The Broadway, NW7 3TG 28 sales
Time to sell Price achieved Price cuts49 Heath Street, NW3 6UF 15 sales
Time to sell Price achieved Price cuts344 Regents Park Road, N3 2LJ 5 sales
Time to sell Price achieved Price cuts
3 offices selling in London
443 sales agreed
1310 Uxbridge Road, UB4 8JH 178 sales
Time to sell Price achieved Price cuts192 High Street, UB8 1LB 169 sales
Time to sell Price achieved Price cuts25 Victoria Road, HA4 9AB 96 sales
Time to sell Price achieved Price cuts
12 offices selling in London
441 sales agreed
27 Greenwich South Street, SE10 8NT 73 sales
Time to sell Price achieved Price cuts7 Stratheden Parade, SE3 7SX 57 sales
Time to sell Price achieved Price cuts310 Mare Street, E8 1EJ 45 sales
Time to sell Price achieved Price cuts23 Tranquil Vale, SE3 0BU 43 sales
Time to sell Price achieved Price cuts644/646 Mile End Road, E3 4LH 37 sales
Time to sell Price achieved Price cuts313 Upper Street, N1 2XQ 36 sales
Time to sell Price achieved Price cuts69 Stoke Newington Church Street, N16 0AR 36 sales
Time to sell Price achieved Price cuts22-23 Harbour Exchange Square, E14 9GE 30 sales
Time to sell Price achieved Price cuts34 Horselydown Lane, SE1 2LN 29 sales
Time to sell Price achieved Price cuts10 New Crane Place, E1W 3TU 26 sales
Time to sell Price achieved Price cutsGround Floor, 67-71 Goswell Road, EC1V 7EP 19 sales
Time to sell Price achieved Price cutsSuite 2.01b, SW9 8DJ 10 sales
Time to sell Price achieved Price cuts
5 offices selling in London
428 sales agreed
135 High Street, RM11 3YD 113 sales
Time to sell Price achieved Price cuts85 Main Road, RM2 5EL 110 sales
Time to sell Price achieved Price cuts16 Station Road, RM14 2UB 109 sales
Time to sell Price achieved Price cuts2 Queens Park Road, RM3 0HJ 94 sales
Time to sell Price achieved Price cuts10 Springfield Lyons Approach, CM2 5LB 2 sales
Time to sell Price achieved Price cuts
4 offices selling in London
423 sales agreed
131 Northcote Road, SW11 6PS 157 sales
Time to sell Price achieved Price cuts255 Balham High Road, SW17 7BE 144 sales
Time to sell Price achieved Price cuts30 Bellevue Road, SW17 7EF 67 sales
Time to sell Price achieved Price cuts370 Garratt Lane, SW18 4ES 55 sales
Time to sell Price achieved Price cuts
13 offices selling in London
420 sales agreed
5-7 Upper Green East, CR4 2PE 64 sales
Time to sell Price achieved Price cuts20 North Street, RM1 1BH 59 sales
Time to sell Price achieved Price cuts7 Grove Road, SM1 1BB 54 sales
Time to sell Price achieved Price cuts2 Wallington Square, SM6 8RG 44 sales
Time to sell Price achieved Price cuts526 Kingsbury Road, NW9 9HE 43 sales
Time to sell Price achieved Price cuts84 London Road, SM4 5BA 37 sales
Time to sell Price achieved Price cuts532 London Road, SM3 8HW 28 sales
Time to sell Price achieved Price cuts300 High Street, BR6 0NF 23 sales
Time to sell Price achieved Price cuts1 Park Terrace, KT4 7JZ 20 sales
Time to sell Price achieved Price cuts20 Streatham High Road, SW16 1DB 19 sales
Time to sell Price achieved Price cuts2a Replingham Road, SW18 5LS 18 sales
Time to sell Price achieved Price cuts2-3 Balham Station Road, SW12 9SG 10 sales
Time to sell Price achieved Price cuts39 Bell Street, RH2 7AQ 1 sale
Time to sell Price achieved Price cuts
8 offices selling in London
396 sales agreed
280 High Street, BR6 0ND 92 sales
Time to sell Price achieved Price cuts19-23 Masons Hill, BR2 9HD 76 sales
Time to sell Price achieved Price cuts3-5 Kelsey Park Road, BR3 6LH 60 sales
Time to sell Price achieved Price cuts104 Sidcup High Street, DA14 6DS 55 sales
Time to sell Price achieved Price cuts423 Crofton Road, BR6 8NL 40 sales
Time to sell Price achieved Price cuts7a High Street, BR7 5AB 37 sales
Time to sell Price achieved Price cuts7 High Street, BR4 0LP 34 sales
Time to sell Price achieved Price cuts68b High Street, TN13 1JR 2 sales
Time to sell Price achieved Price cuts
23 offices selling in London
394 sales agreed
60 High Street, BR3 1AY 56 sales
Time to sell Price achieved Price cuts501 Battersea Park Road, SW11 4LW 37 sales
Time to sell Price achieved Price cuts21 Replingham Road, SW18 5LT 32 sales
Time to sell Price achieved Price cuts9 Cale Street, SW3 3QS 30 sales
Time to sell Price achieved Price cuts323-327 Railton Road, SE24 0JN 28 sales
Time to sell Price achieved Price cuts5 Church Road, SW19 5DW 22 sales
Time to sell Price achieved Price cuts324 Trinity Road, SW18 3RG 15 sales
Time to sell Price achieved Price cuts287 New Kings Road, SW6 4RE 15 sales
Time to sell Price achieved Price cuts45 Turnham Green Terrace, W4 1RG 15 sales
Time to sell Price achieved Price cuts53 Abbeville Road, SW4 9JX 14 sales
Time to sell Price achieved Price cuts239 Earls Court Road, SW5 9AH 14 sales
Time to sell Price achieved Price cuts59 Cadogan Street, SW3 2QJ 13 sales
Time to sell Price achieved Price cuts127 St. Margarets Road, TW1 1RG 13 sales
Time to sell Price achieved Price cuts166 Regents Park Road, NW1 8XN 12 sales
Time to sell Price achieved Price cuts506 Fulham Road, SW6 5NJ 12 sales
Time to sell Price achieved Price cuts125 Gloucester Road, SW7 4TE 12 sales
Time to sell Price achieved Price cuts25 Elizabeth Street, SW1W 9RP 11 sales
Time to sell Price achieved Price cuts31 Sheen Road, TW9 1AD 10 sales
Time to sell Price achieved Price cuts162 Kensington Church Street, W8 4BN 10 sales
Time to sell Price achieved Price cuts15 Belgrave Square, SW1X 8PS 9 sales
Time to sell Price achieved Price cutsUnit 2, E14 9TX 7 sales
Time to sell Price achieved Price cuts129 - 131 Notting Hill Gate, W11 3LB 6 sales
Time to sell Price achieved Price cuts53 High Street, KT10 9RQ 1 sale
Time to sell Price achieved Price cuts
5 offices selling in London
379 sales agreed
7/8 Fairgreen Parade London Road, CR4 3NA 105 sales
Time to sell Price achieved Price cuts101 London Road, SM4 5HP 83 sales
Time to sell Price achieved Price cuts30 Stonecot Hill, SM3 9HE 74 sales
Time to sell Price achieved Price cuts3 Beeches Avenue, SM5 3LB 65 sales
Time to sell Price achieved Price cuts11-13 High Street, SM3 8RQ 52 sales
Time to sell Price achieved Price cuts
7 offices selling in London
357 sales agreed
Takes valuations through Homemove186 Hertford Road, EN3 5AZ 98 sales
Time to sell Price achieved Price cuts6 Church Street, N9 9DX 95 sales
Time to sell Price achieved Price cuts23 Silver Street, EN1 3EF 77 sales
Time to sell Price achieved Price cuts248 Hoe Street, E17 3AX 39 sales
Time to sell Price achieved Price cutsChingford 21 sales
Time to sell Price achieved Price cuts473 High Road, N17 6QA 20 sales
Time to sell Price achieved Price cuts326 Mare Street, E8 1HA 7 sales
Time to sell Price achieved Price cuts
13 offices selling in London
354 sales agreed
4 Ealing Road, HA0 4TL 94 sales
Time to sell Price achieved Price cuts66 The Broadway, HA7 4DU 49 sales
Time to sell Price achieved Price cuts10 Queens Parade, N11 2DN 42 sales
Time to sell Price achieved Price cuts22 The Broadway, NW7 3NJ 30 sales
Time to sell Price achieved Price cuts341 Regents Park Road, N3 1DP 28 sales
Time to sell Price achieved Price cuts52 Golders Green Road, NW11 8LN 27 sales
Time to sell Price achieved Price cuts485-487 Bethnal Green Road, E2 9QH 23 sales
Time to sell Price achieved Price cuts26 West Green Road, N15 5NP 21 sales
Time to sell Price achieved Price cuts58 Church Street, EN2 6AX 12 sales
Time to sell Price achieved Price cuts272 Streatfield Road, HA3 9BY 12 sales
Time to sell Price achieved Price cuts257 Blackfen Road, DA15 8PR 6 sales
Time to sell Price achieved Price cuts29 Walm Lane, NW2 5SH 6 sales
Time to sell Price achieved Price cuts70 Essex Road, N1 8LT 4 sales
Time to sell Price achieved Price cuts
Meridian House, Wheatfield Way, LE10 1YG
338 sales agreed

4 offices selling in London
336 sales agreed
157 Portland Road, SE25 4UX 104 sales
Time to sell Price achieved Price cuts1 Bingham Corner Lower Addiscombe Road, CR0 7AA 89 sales
Time to sell Price achieved Price cuts270 Streatham High Road, SW16 6HE 86 sales
Time to sell Price achieved Price cuts172 - 176 Norwood Road, SE27 9AZ 57 sales
Time to sell Price achieved Price cuts
5 offices selling in London
317 sales agreed
4 York Street, TW1 3LD 122 sales
Time to sell Price achieved Price cuts7 Odeon Parade, TW7 4DE 58 sales
Time to sell Price achieved Price cuts101 High Street, TW12 1NJ 57 sales
Time to sell Price achieved Price cuts24 Red Lion Street, TW9 1RW 53 sales
Time to sell Price achieved Price cuts124 St. Margarets Road, TW1 2AA 27 sales
Time to sell Price achieved Price cuts
11 offices selling in London
308 sales agreed
8 Well Hall Road, SE9 6SF 57 sales
Time to sell Price achieved Price cuts163 New Cross Road, SE14 5DG 53 sales
Time to sell Price achieved Price cuts115 High Street, TW2 7LG 47 sales
Time to sell Price achieved Price cuts167 Hoe Street, E17 3AL 36 sales
Time to sell Price achieved Price cuts1 Wilton Road, SE2 9RH 36 sales
Time to sell Price achieved Price cuts186 Westcombe Hill, SE3 7DH 22 sales
Time to sell Price achieved Price cuts1 West Street, BR1 1RE 21 sales
Time to sell Price achieved Price cutsThe Railway Bridge, 2/3 Regent Parade, SM2 5BQ 21 sales
Time to sell Price achieved Price cuts51A Woodcote Road, SM6 0LT 9 sales
Time to sell Price achieved Price cutsUnit 1 113, DA6 7JH 4 sales
Time to sell Price achieved Price cuts22 Claremont Road, KT6 4QU 2 sales
Time to sell Price achieved Price cuts
6 offices selling in London
305 sales agreed
6 & 7 Regent Parade, SM2 5BQ 134 sales
Time to sell Price achieved Price cuts21 Woodcote Road, SM6 0LH 60 sales
Time to sell Price achieved Price cuts137 Wickham Road, CR0 8TE 55 sales
Time to sell Price achieved Price cuts917 Brighton Road, CR8 2BP 51 sales
Time to sell Price achieved Price cuts47 High Street, SM7 2NL 4 sales
Time to sell Price achieved Price cuts53 Croydon Road, CR3 6PD 1 sale
Time to sell Price achieved Price cuts
5 offices selling in London
302 sales agreed
Takes valuations through Homemove32 High Street Wanstead, E11 2RJ 70 sales
Time to sell Price achieved Price cuts242 Chingford Mount Road, E4 8JL 64 sales
Time to sell Price achieved Price cuts194-196 George Lane, E18 1AY 60 sales
Time to sell Price achieved Price cuts141 Hoe Street, E17 3AL 55 sales
Time to sell Price achieved Price cuts157 Station Road, E4 6AG 53 sales
Time to sell Price achieved Price cuts
4 offices selling in London
296 sales agreed
399 Mile End Road, E3 4PB 96 sales
Time to sell Price achieved Price cuts336 Mare Street, E8 1HA 90 sales
Time to sell Price achieved Price cuts152-154 The Grove, E15 1NS 61 sales
Time to sell Price achieved Price cuts6-8 Great Eastern Street, EC2A 3NT 49 sales
Time to sell Price achieved Price cuts
4 offices selling in London
294 sales agreed
9 Station Buildings, SW20 8NE 104 sales
Time to sell Price achieved Price cuts13 Queens Road, SW19 8PF 87 sales
Time to sell Price achieved Price cuts127 High Street. Colliers Wood, SW19 2HR 56 sales
Time to sell Price achieved Price cuts24 Crown Lane, SM4 5BL 47 sales
Time to sell Price achieved Price cuts
8 offices selling in London
292 sales agreed
438 Hertford Road, N9 8AB 88 sales
Time to sell Price achieved Price cuts243-245 Hertford Road, EN3 5JJ 64 sales
Time to sell Price achieved Price cuts12 Topsfield Parade, N8 8PR 61 sales
Time to sell Price achieved Price cuts78 Green Lanes, N13 6BE 46 sales
Time to sell Price achieved Price cuts44 Lower Clapton Road, E5 0RN 19 sales
Time to sell Price achieved Price cuts44-46 West Green Road, N15 5NR 12 sales
Time to sell Price achieved Price cuts2 Highbridge Street, EN9 1DG 1 sale
Time to sell Price achieved Price cuts62-64 High Road, WD23 1GG 1 sale
Time to sell Price achieved Price cuts
7 offices selling in London
292 sales agreed
219-221 Lower Addiscombe Road, CR0 6RB 71 sales
Time to sell Price achieved Price cuts263 High Street, CR0 1QH 46 sales
Time to sell Price achieved Price cuts737-739 London Road, CR7 6AU 46 sales
Time to sell Price achieved Price cutsCrystal Palace Office Westow Street, London, SE19 3AH 41 sales
Time to sell Price achieved Price cuts25 High Street, SE25 6EZ 36 sales
Time to sell Price achieved Price cuts936 Brighton Road, CR8 2LP 31 sales
Time to sell Price achieved Price cuts148 Brighton Road, CR5 2ND 21 sales
Time to sell Price achieved Price cuts
4 offices selling in London
287 sales agreed
1 High Street, HA5 5PJ 181 sales
Time to sell Price achieved Price cuts7 Clive Parade, HA6 2QF 74 sales
Time to sell Price achieved Price cutsMoor Park Estate Office, North Approach, HA6 2JQ 30 sales
Time to sell Price achieved Price cuts2 New Parade, WD3 5NJ 2 sales
Time to sell Price achieved Price cuts
6 offices selling in London
286 sales agreed
104 Wickham Road, BR3 6QH 71 sales
Time to sell Price achieved Price cuts318 Pickhurst Lane, BR4 0HT 70 sales
Time to sell Price achieved Price cuts1 Fairway, BR5 1EF 44 sales
Time to sell Price achieved Price cuts11 Plaistow Lane, BR1 4DS 41 sales
Time to sell Price achieved Price cuts285-287 Wickham Road, CR0 8TJ 32 sales
Time to sell Price achieved Price cuts102-104 High Street, BR3 1EB 28 sales
Time to sell Price achieved Price cuts
11 offices selling in London
269 sales agreed
22 College Approach, SE10 9HY 67 sales
Time to sell Price achieved Price cutsUnex Tower, 5 Station Street, E15 1DA 63 sales
Time to sell Price achieved Price cuts11 Westferry Circus, E14 4HE 32 sales
Time to sell Price achieved Price cutsThe Walbrook Building, 25 Walbrook, EC4N 8AF 24 sales
Time to sell Price achieved Price cutsUnit B, Parkway Apartments, N4 2BL 22 sales
Time to sell Price achieved Price cutsUnit C1, SW11 8DG 18 sales
Time to sell Price achieved Price cuts375 Kensington High Street, W14 8QA 16 sales
Time to sell Price achieved Price cuts2 Cale Street, SW3 3QU 15 sales
Time to sell Price achieved Price cuts13a St George St, W1S 1FE 7 sales
Time to sell Price achieved Price cutsALINGTON HOUSE, 1 MARY NEUNER ROAD, N8 0ER 4 sales
Time to sell Price achieved Price cutsLily House, 12 Capital Interchange Way, TW8 0SP 1 sale
Time to sell Price achieved Price cutsThese are the 48 busiest of 1,475 London agencies. Each agency's offices are added together. Your free account shows every agent near your home.
Free with a Homemove account
All 1,475 London agencies, each with their own time to sell, and price achieved where enough completed sales are available next to the London median of 70 days. Pick the ones you like and book their free valuations from the same screen.
Create my free accountTakes about 2 minutes. No calls unless you ask for a valuation.
Against the neighbours
London agents find a buyer 1 day slower than the Greater London median of 69 days. Homes sell faster here than in Westminster and Camden. The middle London agency cut the price on 34.5% of its listings, about the same as Camden (34.1%).
| Area | Days to sell | Of asking | Price cut |
|---|---|---|---|
| London This town | 70 | 97.5% | 34.5% |
| All of Greater London | 69 | 97.5% | 34.2% |
| Westminster 1.8 km | 155 | – | 45.5% |
| City of London 2.5 km | – | – | – |
| Camden 4.6 km | 73 | – | 34.1% |
5 agencies here take valuation requests through Homemove, marked on their card. That never changes the order.
Local life
October saw the most sales agreed in London over the last year, and December the fewest.
How we know
Powered by HomeData, the property data behind home.co.uk. Read the full method. Spotted something wrong? Tell us and we will correct it.
FAQ
1,475 estate agencies agreed at least one sale in London from 9 November 2025 to 8 November 2026, from 2,400 offices between them. 486 of the agencies agreed 20 or more.
Kinleigh Folkard & Hayward agreed the most sales in London's postcode districts (3,064 sales agreed from 9 November 2025 to 8 November 2026, 4.7% of all sales), ahead of Winkworth (2,017) and Foxtons (1,954). Every office of the same agency is added together, and a home matched to its UPRN counts once.
Streets Ahead agreed the most sales across the whole of CR0, which covers Croydon, Shirley and Addiscombe, from 9 November 2025 to 8 November 2026: 8.9% of the 1,331 sales agreed there, ahead of Barnard Marcus (7.1%).
Central agreed the most sales across the whole of E17, which covers Walthamstow and Lloyd Park, from 9 November 2025 to 8 November 2026: 30.9% of the 1,215 sales agreed there, ahead of The Stow Brothers (27.2%).
Kinleigh Folkard & Hayward agreed the most sales across the whole of SW19, which covers Wimbledon, Colliers Wood and Merton Park, from 9 November 2025 to 8 November 2026: 18% of the 782 sales agreed there, ahead of Ellisons (17%).
Kinleigh Folkard & Hayward agreed the most sales across the whole of BR3, which covers Beckenham, Park Langley and Langley Waterside, from 9 November 2025 to 8 November 2026: 18.9% of the 758 sales agreed there, ahead of Proctors (11.6%).
Hubbard Torlot agreed the most sales across the whole of CR2, which covers South Croydon, Sanderstead and Selsdon, from 9 November 2025 to 8 November 2026: 12.1% of the 711 sales agreed there, ahead of Pollard Machin (9.3%).
Gibbs Gillespie agreed the most sales across the whole of HA4, which covers Ruislip and Eastcote, from 9 November 2025 to 8 November 2026: 22.8% of the 675 sales agreed there, ahead of Coopers (22.2%).
The middle London agency agreed a sale 70 days after a home went on the market. That is the median of each agency's own median, across the 486 agencies with 20 or more sales agreed here from 9 November 2025 to 8 November 2026. It runs to sale agreed; completion follows once the legal work is done.
The middle London agency sold for 97.5% of the first asking price, going by completed Land Registry prices. Only agencies with at least 20 completed sales on the register count, 202 of them here. The middle agency cut the price on 34.5% of its listings along the way.
London agents find a buyer 1 day slower than the Greater London median of 69 days. Homes sell faster here than in Westminster and Camden. The middle London agency cut the price on 34.5% of its listings, about the same as Camden (34.1%).
They cover 235,143 homes listed for sale in BR1, BR2, BR3, BR4, BR5, BR6, BR7, CR0, CR2, CR4, CR5, CR7, CR8, DA14, DA15, DA18, E1, E1W, E2, E3, E4, E5, E6, E7, E8, E9, E10, E11, E12, E13, E14, E15, E16, E17, E18, E20, EC1A, EC1M, EC1N, EC1R, EC1V, EC1Y, EC2A, EC2Y, EC3A, EC3N, EC4A, EC4V, EN1, EN2, EN3, EN4, EN5, HA0, HA1, HA2, HA3, HA4, HA5, HA6, HA7, HA8, HA9, IG1, IG2, IG3, IG4, IG5, IG6, IG8, IG11, KT3, KT4, KT9, N1, N1C, N2, N3, N4, N5, N6, N7, N8, N9, N10, N11, N12, N13, N14, N15, N16, N17, N18, N19, N20, N21, N22, NW1, NW2, NW3, NW4, NW5, NW6, NW7, NW8, NW9, NW10, NW11, RM1, RM2, RM3, RM5, RM6, RM7, RM8, RM9, RM10, RM11, RM12, RM13, RM14, SE1, SE2, SE3, SE4, SE5, SE6, SE7, SE8, SE9, SE10, SE11, SE12, SE13, SE14, SE15, SE16, SE17, SE18, SE19, SE20, SE21, SE22, SE23, SE24, SE25, SE26, SE27, SE28, SM1, SM2, SM3, SM4, SM5, SM6, SW1A, SW1E, SW1H, SW1P, SW1V, SW1W, SW1X, SW1Y, SW2, SW3, SW4, SW5, SW6, SW7, SW8, SW9, SW10, SW11, SW12, SW13, SW14, SW15, SW16, SW17, SW18, SW19, SW20, TN16, TW1, TW2, TW3, TW4, TW5, TW7, TW8, TW9, TW10, TW12, TW14, UB1, UB2, UB3, UB4, UB5, UB6, UB7, UB8, UB9, UB10, W1B, W1D, W1F, W1G, W1H, W1J, W1K, W1S, W1T, W1U, W1W, W2, W3, W4, W5, W6, W7, W8, W9, W10, W11, W12, W13, W14, WC1A, WC1B, WC1E, WC1H, WC1N, WC1R, WC1V, WC1X, WC2A, WC2B, WC2E, WC2H, WC2N and WC2R from 9 November 2025 to 8 November 2026, as tracked by home.co.uk. 90.6% were matched to the exact property by its UPRN; the rest are counted by listing. A sale is the day a home first went sold subject to contract, so a sale that later falls through still counts once, and a relisted home counts once when it is matched to its UPRN; an unmatched home listed by two agencies can count twice. Price achieved uses completed Land Registry sales only. The data is powered by HomeData and rebuilt every week; this page was last updated 9 November 2026.
No. The league table is worked out from listings alone and is never paid for. Agents can pay Homemove for valuation requests and featured places, and those are always labelled and kept apart from the ranking.
486 of the 1,475 London agencies agreed 20 or more sales last year, enough of a record to judge. Ask two or three that sell homes like yours to value it, then compare how fast they sell (the London median is 70 days) and how close they get to the asking price (97.5% here), not only the valuation they quote. A free Homemove account shows those figures for every agent on this page where there are enough sales to judge.
Compare every agent's record and book free valuations with the ones you like. The rest of the move sits in the same account.
Start free






 Takes valuations through Homemove

