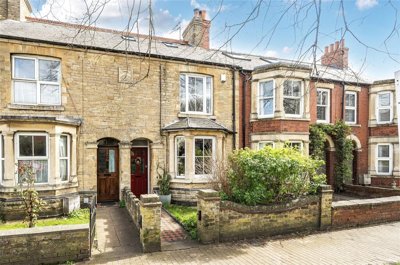
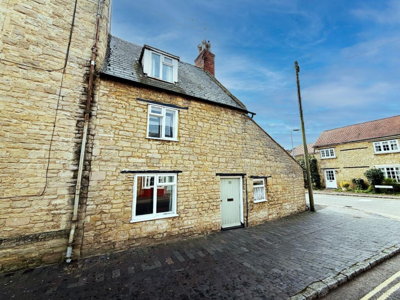
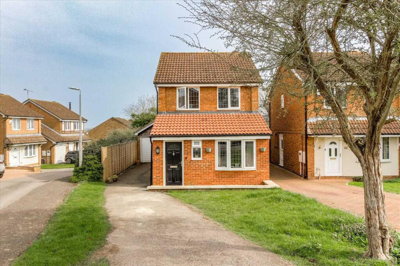
£575,000
Terraced, 4 bed
Wellingborough Road, MK46 4BJ
£575,000
Terraced, 4 bed
Wellingborough Road, MK46 4BJ

Compare 23 local agents, data from 146 active listings


We track 23 estate agents actively marketing properties in Olney, and we've ranked them all based on live listing data, market share, and average asking prices. selling a family home near the town centre or a period property in the surrounding villages, our analysis helps you identify the agents with the strongest local presence.
The Olney property market offers a diverse range of homes, from traditional terraced houses to detached family residences. With an average asking price of £454,816 across 146 active listings, this Milton Keynes market town continues to attract buyers seeking a balance of rural charm and good transport links to nearby employment hubs. Our comparison tool puts you in touch with the top-performing agents in your area, completely free.
Selling a property in a market town like Olney requires an agent who understands the local nuances. The MK46 postcode area has seen price adjustments recently, with properties selling between £3,940 and £4,610 per square metre. An experienced local estate agent can help you navigate these conditions and achieve the best possible price for your home.

23
Active Estate Agents
£454,816
Average Asking Price
146
Properties For Sale
The Olney housing market has experienced notable price adjustments over the past year, with Land Registry data showing sold prices falling 2% compared to the previous year and 12% below the 2023 peak of £494,371. The MK46 5 postcode sector has seen prices decline by 5.3% annually, with an 8.8% reduction when adjusted for inflation. Our current listing data shows 146 properties on the market with an average asking price of £454,816, though Rightmove reports a slightly lower average of £433,854 while Zoopla cites £420,359.
Transaction volumes in the area remain healthy, with 222 property sales recorded in MK46 5 during the last twelve months. Half of all properties sold achieved between £3,940 and £4,610 per square metre, indicating reasonable demand despite the broader market cooling. The discrepancy between asking and sold prices suggests that buyers are negotiating discounts, with our data showing asking prices have changed by -0.9% in just the past six months and the current average listing price sits 8.65% below where it was six months ago.
Detached properties command the highest prices in Olney, with current listings averaging £612,361 according to our Atlas data, while Rightmove reports £589,686 and Zoopla £590,115 for this sector. Semi-detached homes average around £413,750, terraced properties £352,912, and flats £253,333. The premium for detached homes reflects the strong demand for family-sized accommodation in this sought-after Buckinghamshire market town and its surrounding villages.
The current market presents both challenges and opportunities for sellers. With 71 properties in the £300k-£500k range competing for buyer attention, pricing your home correctly from the outset is essential. Agents with deep local knowledge can provide accurate valuations based on recent comparable sales in specific neighbourhoods, helping you set a competitive asking price that attracts serious buyers.
Based on 53 live listings with an average asking price of £460,565.
Source: home.co.uk
See which agents are selling fastest and at the best prices in Olney.
Compare Estate Agents FreeNew build activity in Olney remains limited, with the most notable recent development being Penny House on Teedon Lane, a McCarthy Stone retirement village offering one and two-bedroom apartments priced from £289,999 to £399,999. This reflects the aging demographic trend in the area and the demand for downsizing options among older residents. The broader Milton Keynes and Northamptonshire areas continue to see significant new housing development, with major developments at Woburn Downs and Towcester Grange drawing buyers from the Olney area.
Property type distribution in Olney shows detached properties comprising 36 of the current listings, with semi-detached homes accounting for 28 and terraced properties at 17. Flats represent 15 listings, with the remaining 50 properties falling into other categories. The dominance of detached and semi-detached housing reflects Olney's character as a family-friendly market town with good primary schools and local amenities. Transaction data indicates that three-bedroom properties remain the most popular configuration, matching the strong semi-detached and terraced stock in the area.
Looking at bedroom distribution, two and three-bedroom properties dominate with 42 and 43 listings respectively, averaging £324,511 and £422,791. Four-bedroom detached homes represent 31 listings at an average of £597,097, appealing to families needing more space. One-bedroom properties offer affordable entry points at £210,446 average, while premium five-bedroom homes command an average of £855,833. This range makes Olney suitable for first-time buyers, growing families, and those looking to downsize.
Olney is a historic market town in Buckinghamshire with a population of approximately 6,600 residents across 2,865 households. The town sits on the River Great Ouse and is known for its Conservation Area, which Milton Keynes Council is currently reviewing with adoption planned for late 2025. This designation reflects Olney's architectural heritage, with numerous period properties and traditional buildings that contribute to the town's distinctive character. The presence of listed buildings and the Conservation Area means that any significant renovations or extensions require careful consideration of planning constraints.
Transport links from Olney make it attractive to commuters, with Milton Keynes, Northampton, and Bedford all accessible within 20 to 40 minutes by car. The market town itself offers essential amenities including supermarkets, independent shops, and primary schools, while the nearby larger centres provide additional retail, entertainment, and employment opportunities. This positioning as a "commuter village" influences the housing market, with many buyers working in the surrounding towns but preferring Olney's quieter, more rural environment.
Flood risk is a consideration for certain areas of Olney, particularly along the River Great Ouse. Church Street and the Olney Tennis and Cricket Clubs fall within the flood warning area, and river levels can rise significantly after heavy rainfall. The Environment Agency monitors river levels in the MK46 postcode area. Additionally, the geological context of Buckinghamshire suggests clay-rich soils that could present shrink-swell potential, a common cause of subsidence in the South East of England. Prospective buyers should factor these environmental considerations into their property decisions.
The local economy centres largely on commuting to nearby employment hubs, with many residents working in Milton Keynes's growing technology and logistics sectors, as well as in Northampton's manufacturing and distribution centres. This commuter demographic shapes buyer preferences, with properties offering good transport connections and home office space particularly sought after. The town also benefits from a strong sense of community, with regular markets, local festivals, and various sports clubs contributing to its appeal as a place to put down roots.
Stephen Oakley & Co dominates the local market with 32 active listings representing a 21.9% market share and an average asking price of £393,359, making them the go-to agent for properties in the mid-range segment. Michael Graham follows closely with 30 listings and a 20.5% market share, positioning themselves at the premium end with an average asking price of £518,583. Margaret James holds 9.6% of the market with 14 listings averaging £484,643, while Fine & Country, operating through Carters Estate Agents, targets the luxury sector with nine listings at an impressive average of £680,550.
When selecting an estate agent in Olney, consider whether you need a high-street presence or are comfortable with an online-only model. The top agents locally all maintain physical offices, which can be valuable for handling viewings and negotiations in person. Fee structures typically range from 1% to 3% plus VAT, with sole agency agreements lasting 8-16 weeks. Given the current market conditions with prices softening, negotiating on fees becomes particularly important, especially if you're using multiple agents through a multi-agency agreement which typically costs an additional 0.5-1%.
Always obtain a free valuation from at least three agents before instructing anyone. This gives you not only a sense of the realistic selling price but also an opportunity to assess each agent's local knowledge and marketing approach. The differences in valuations can be significant, and an agent who understands Olney's specific market dynamics, including the impact of the Conservation Area and local school catchment zones, will provide a more accurate assessment than one applying generic regional figures.
Beyond fees and valuations, consider each agent's marketing strategy. Quality photography, floor plans, and virtual tours can significantly impact how quickly your property sells. Ask about their database of registered buyers, their presence on major property portals, and how they plan to generate interest in your specific property. Agents with strong local networks often have buyers already waiting for properties like yours to come to market.
Look at how many active listings each agent has in Olney and their average asking prices. Our data shows Stephen Oakley & Co leads with 32 listings, but the right agent depends on your property type and price point.
Request free valuations from at least three agents. Compare not just the figures but their local knowledge and marketing strategies for your specific property.
Agents with higher market share typically sell more properties in your area. The top three agents in Olney control over 52% of the market.
Typical fees range from 1-3% plus VAT. Ask about sole agency versus multi-agency terms and what services are included.
Ask about photography, floor plans, online presence, and how they plan to market your property to the right buyers.
Look for feedback from sellers in Olney specifically, not just generic reviews about the brand.
Don't accept the first fee offered. Given current market conditions, agents may be willing to negotiate, especially for well-priced properties in high demand.
With the current market showing a 12% decline from the 2023 peak, pricing your property correctly from the outset is crucial. Agents with strong local knowledge, like Stephen Oakley & Co who understand the Olney market dynamics, can help you set a realistic asking price that attracts serious buyers and achieves a faster sale.
For landlords considering the rental market, Olney offers moderate returns with 29 properties currently available to let. Marcus Jordan & Co dominates this sector with 19 listings, achieving an average rental price of £1,271 per month. Michael Graham handles premium rentals at higher price points, averaging £1,863 per month for their four listings. The rental market presents opportunities given the limited stock, particularly for well-presented family homes.
The buy-to-let sector in Olney may benefit from the town's commuter location, with tenants seeking affordable housing options relative to nearby Milton Keynes and Northampton. One-bedroom properties at the lower price points could offer attractive rental yields, though investors should factor in management costs and potential void periods. The McCarthy Stone developments cater specifically to older tenants downsizing, representing a different rental niche.
53 properties currently listed across Olney. Here are the most recently added.
£575,000
Terraced, 4 bed
Wellingborough Road, MK46 4BJ
£575,000
Terraced, 4 bed
Wellingborough Road, MK46 4BJ
£525,000
House, 3 bed
Timpsons Row, MK46 4JJ
£525,000
House, 3 bed
Timpsons Row, MK46 4JJ
£330,000
Terraced, 3 bed
Silver End, MK46 4AT
£330,000
Terraced, 3 bed
Silver End, MK46 4AT
£550,000
Not Specified, 4 bed
Oxleys, MK46 5PH
£550,000
Not Specified, 4 bed
Oxleys, MK46 5PH
£275,000
Cottage, 2 bed
Weston Road, MK46 5BD
£275,000
Cottage, 2 bed
Weston Road, MK46 5BD
£295,000
Semi-Detached, 2 bed
Kippell Hill, MK46 5ER
£295,000
Semi-Detached, 2 bed
Kippell Hill, MK46 5ER
£225,000
Semi-Detached, 3 bed
East Street, MK46 4AP
£225,000
Semi-Detached, 3 bed
East Street, MK46 4AP
£300,000
End of Terrace, 2 bed
East Street, MK46 4BU
£300,000
End of Terrace, 2 bed
East Street, MK46 4BU
£425,000
Detached, 3 bed
Oxleys, MK46 5PJ
£425,000
Detached, 3 bed
Oxleys, MK46 5PJ
£935,000
Semi-Detached, 4 bed
Church Street, MK46 4AD
£935,000
Semi-Detached, 4 bed
Church Street, MK46 4AD
£325,000
Apartment, 1 bed
Teedon Lane, MK46 4FS
£325,000
Apartment, 1 bed
Teedon Lane, MK46 4FS
£1,100,000
Detached, 5 bed
Beech Avenue, MK46 5AE
£1,100,000
Detached, 5 bed
Beech Avenue, MK46 5AE
Get free, no-obligation valuations from the top-performing local agents. Compare fees, services, and track records before you decide.
Compare Agents FreeBased on our live listing data, Stephen Oakley & Co leads the market with 32 active listings and 21.9% market share, followed by Michael Graham with 30 listings and 20.5% share. Margaret James and Fine & Country also have strong presences. The best agent for you depends on your property type and price range, with Fine & Country handling premium properties at £680,550 average and Stephen Oakley & Co focusing on the mid-market at £393,359. Consider your specific needs - if you have a luxury property, Fine & Country's Carters operation may be preferable, while standard family homes might be better served by the higher-street presence of Stephen Oakley & Co or Michael Graham.
Estate agent fees in Olney typically range from 1% to 3% plus VAT (1.2% to 3.6% total), which aligns with national averages. The average fee across England is approximately 1.5% plus VAT. In the current market, with prices softening, sellers may have more room to negotiate on fees, particularly if an agent is eager to secure your business. Don't be afraid to ask for discounts or enhanced marketing packages included in the fee. Some agents may also offer fixed-fee options for straightforward sales.
No, house prices in Olney have been declining. The MK46 5 postcode saw prices fall 5.3% in the last year and 8.8% after inflation. Overall, sold prices are 2% down on the previous year and 12% below the 2023 peak of £494,371. Asking prices have also decreased by 0.9% in the past six months, with the current average listing price sitting 8.65% below where it was six months ago. This trend suggests a buyer's market where realistic pricing is essential for achieving sales.
Olney is a historic market town in Buckinghamshire with a population of around 6,600. It offers a Conservation Area, good local schools, and access to the River Great Ouse. The town serves as a commuter base with Milton Keynes, Northampton, and Bedford all within 40 minutes. It has a range of amenities including shops, pubs, and sports facilities, with a strong community atmosphere. The upcoming Conservation Area review by Milton Keynes Council, planned for late 2025, will continue to preserve the town's architectural character.
The market offers good variety with 36 detached homes (averaging £612,361), 28 semi-detached (£413,750), 17 terraced (£352,912), and 15 flats (£253,333). Two and three-bedroom properties dominate with 85 listings between them, making Olney suitable for first-time buyers, families, and downsizers alike. The price range spans from one-bedroom flats around £210,000 to premium five-bedroom homes exceeding £850,000, providing options across the market spectrum.
New build activity in Olney itself is limited. Penny House on Teedon Lane is a McCarthy Stone retirement development with one and two-bedroom apartments from £289,999 to £399,999. Buyers looking for newer properties may need to consider surrounding areas with larger developments at Woburn Downs near Milton Keynes or Towcester Grange in Northamptonshire, though these are technically in nearby towns rather than Olney itself. The St Josephs Convent site on West Street has planning approval for 11 new dwellings.
Online agents typically charge fixed fees between £999 and £1,999, which can be cheaper than high-street agents for straightforward sales. However, the top-performing agents in Olney all maintain physical offices and high market shares. If your property is unusual or in the premium segment, a local agent with established relationships and local knowledge may achieve a better result. The personal touch of a high-street agent can be valuable for handling viewings, negotiations, and any issues that arise during the sale process.
A good valuation should reflect current Olney market conditions, including recent comparable sales in your specific neighbourhood and the impact of any local factors like the Conservation Area or flood risk zones. Be wary of agents who value significantly above the average, as this may simply be a tactic to win your business. Our data shows the average asking price is £454,816, so ensure your agent's figure is realistic. Ask them to explain their reasoning with specific comparable properties, and check how well their previous valuations have translated into actual sales.
The current market conditions mean properties may take longer to sell than during the 2023 peak. With 146 active listings and 222 annual transactions in the MK46 5 area, competition is moderate. Properties priced correctly tend to sell within 8-12 weeks, while those priced optimistically can linger on the market for months. Your choice of agent and pricing strategy significantly impacts sale speed. Agents with strong local networks and active buyer databases can often generate interest more quickly.
Parts of Olney, particularly along the River Great Ouse, carry flood risk. Church Street and the Olney Tennis and Cricket Clubs fall within the flood warning area, and river levels can rise significantly after heavy rainfall. The Environment Agency monitors levels in the MK46 postcode. If you're considering a property in these areas, discuss flood risk with your surveyor and ensure appropriate insurance is obtainable. Properties in higher-ground areas of Olney face minimal flood risk.
From £450
Recommended for standard properties in reasonable condition. Identifies defects like damp, roofing issues, and structural concerns common in Olney's older homes.
From £600
Comprehensive survey for older properties, unusual construction, or if you're planning significant renovations. Essential for period properties in Olney's Conservation Area.
From £60
Required by law before marketing your property. An energy efficiency rating affects buyer interest and property value.
From £150
Required by lenders if you're remortgaging or the property is being purchased with a mortgage. Confirms the property value for lending purposes.
Estate Agents In London

Estate Agents In Plymouth

Estate Agents In Liverpool

Estate Agents In Glasgow

Estate Agents In Sheffield

Estate Agents In Edinburgh

Estate Agents In Coventry

Estate Agents In Bradford

Estate Agents In Manchester

Estate Agents In Birmingham

Estate Agents In Bristol

Estate Agents In Oxford

Estate Agents In Leicester

Estate Agents In Newcastle

Estate Agents In Leeds

Estate Agents In Southampton

Estate Agents In Cardiff

Estate Agents In Nottingham

Estate Agents In Norwich

Estate Agents In Brighton

Estate Agents In Derby

Estate Agents In Portsmouth

Estate Agents In Northampton

Estate Agents In Milton Keynes

Estate Agents In Bournemouth

Estate Agents In Bolton

Estate Agents In Swansea

Estate Agents In Swindon

Estate Agents In Peterborough

Estate Agents In Wolverhampton

Compare 23 local agents, data from 146 active listings
Find AgentsHomemove is a trading name of HM Haus Group Ltd (Company No. 13873779, registered in England & Wales). Homemove Mortgages Ltd (Company No. 15947693) is an Appointed Representative of TMG Direct Limited, trading as TMG Mortgage Network, which is authorised and regulated by the Financial Conduct Authority (FRN 786245). Homemove Mortgages Ltd is entered on the FCA Register as an Appointed Representative (FRN 1022429). You can check registrations at NewRegister or by calling 0800 111 6768.
We use cookies to show you personalised content and improve your experience of our website. Find out more in our Privacy policy and Cookie policy.