
£157,995
Mobile Home, 2 bed
Watermill Road, IP12 4NW
£157,995
Mobile Home, 2 bed
Watermill Road, IP12 4NW

Compare 3 local agents, data from 8 active listings


We track 3 estate agents actively marketing properties in Newbourne, and we've ranked them all based on live listing data. selling a period cottage on The Street or a modern home near the village centre, finding the right agent can make a significant difference to your final sale price and how quickly your property moves. Our comparison tool lets you request quotes from multiple agents, so you can find the best fit for your specific property and selling goals.
Newbourne sits in a desirable position on the Suffolk coast, forming a peninsula between the Rivers Orwell and Deben. This peaceful village setting offers buyers attractive countryside walks and waterside views while maintaining easy access to larger towns like Woodbridge and Felixstowe. The current market shows properties ranging from cottages to substantial family homes, with our data showing an average asking price of £282,874 across 8 active listings.

3
Active Estate Agents
£282,874
Average Asking Price
8
Properties For Sale
The Newbourne property market presents an interesting picture for sellers and buyers alike. According to our research, the average sold house price over the last 12 months sits at approximately £328,000, though this varies significantly between data sources. Rightmove reports an overall average of £417,500 for properties sold in the village over the past year, while Zoopla's figures indicate £328,333 for verified sales. This discrepancy often reflects the mix of property types that have changed hands during the measurement period.
Price trends in Newbourne have shown notable volatility in recent years. Land Registry data and Rightmove analysis suggest that sold prices were approximately 52% higher than the previous year in their measurement, though this figure relates to specific transaction volumes and property types rather than consistent annual growth. More concerning for current sellers is that prices remain approximately 38% below the 2021 peak of £676,500 according to Rightmove's historical analysis. OnTheMarket reports a 12.4% fall in sold prices over the last 12 months, suggesting the market continues to adjust following the post-pandemic boom. The relatively low transaction volume in a village of this size means individual high-value sales can significantly skew average figures, making it essential for sellers to obtain accurate local valuations rather than relying solely on broad averages.
Properties in the £100,000 to £200,000 range currently dominate the active listings in our data, with three properties in this band, while premium homes above £500,000 represent a smaller but meaningful segment of the market. Our listing data reveals one property under £100,000, two listings in the £200,000 to £300,000 bracket, and two premium listings above £500,000. This distribution suggests healthy demand across different buyer segments, from first-time purchasers to those seeking substantial family homes in this attractive Suffolk village.
Based on 7 live listings with an average asking price of £216,142.
Source: home.co.uk
See which agents are selling fastest and at the best prices in Newbourne.
Compare Estate Agents FreeNewbourne's housing stock reflects its character as a traditional Suffolk village, with period properties dominating the built environment. Our listing data shows that properties described as "Other" in our classification system, typically including cottages and smaller period homes, make up the majority of current stock with 6 listings averaging £168,833. Detached properties, representing the higher end of the market, account for 2 listings with an average asking price of £625,000, suggesting strong demand for larger family homes in the village.
New build activity within Newbourne itself remains limited. Our research identifies only isolated planning applications, including proposals for two homes on land off Mill Road and a two-storey development at Oak View Farm involving the demolition of existing buildings. The Savills listing mentions one new home available described as a high-quality barn conversion in a private rural setting, appealing to buyers seeking character properties with modern conveniences. Holiday lodges at Lakeside in Newbourne offer alternatives from £176,000 to £230,000, though these represent twelve-month occupancy options rather than traditional residential purchases. The nearby Taylor Wimpey Brightwell Lakes development in Martlesham represents the most significant new build activity in the surrounding area, though technically located in a neighbouring parish.
Newbourne occupies a distinctive geographical position on the Suffolk coast, forming part of a peninsula nestled between the River Orwell to the north and the River Deben to the south. This setting provides residents with attractive waterside walks and countryside views while maintaining a sense of separation from busier coastal towns. The village centre concentrates along The Street, where period houses built between 1800 and 1911 create the architectural character that defines much of Newbourne's appeal. The village benefits from its proximity to the market towns of Woodbridge and Felixstowe, both offering mainline railway stations, comprehensive shopping facilities, and secondary education options.
The historical heritage of Newbourne is evident in its collection of listed buildings that punctuate the village landscape. The Church of St Mary holds Grade I listed status, representing the highest level of architectural significance, while Newbourne Hall carries Grade II* recognition as a partly timber-framed and plastered building dating from the early 16th and early 17th centuries, constructed partially in red brick. The Fox Public House, dating from the late 17th to early 18th century, represents another significant heritage asset, providing the village with its primary social venue. The Newbourne War Memorial stands as a poignant reminder of the village's wartime contributions.
While comprehensive demographic data specific to Newbourne remains limited in available research, the village clearly functions as a residential community serving workers in surrounding towns. The absence of large-scale new build developments within the village boundary suggests that growth has been carefully managed, preserving the character that attracts buyers seeking an authentic Suffolk village experience. Local amenities include The Fox public house, providing food and community gatherings, while daily necessities typically require a short journey to nearby Woodbridge or Felixstowe. Properties along The Street command premium prices due to their period features and village centre location, with analysis showing values per square foot reaching approximately £369 in this sought-after road.
Sellers in Newbourne face the traditional choice between high-street estate agents with physical offices in surrounding towns and online agents offering fixed-fee structures. Our data reveals that James & Co, based in Great Dunmow but actively marketing in the area, currently dominates the local market with 75% market share across 6 active listings. This independent agency focuses on properties at the more affordable end of the Newbourne market, with an average asking price of £168,833 across their portfolio. Their significant market presence suggests strong local connections or marketing reach that brings sellers to their door.
At the premium end of the market, Diamond Mills & Co operates from Felixstowe and handles higher-value properties, currently marketing one listing at £750,000 in Newbourne. This represents the top end of the village's property spectrum, likely a substantial period property or modern family home. William H. Brown, with an office in Woodbridge, similarly targets the upper market segment with a listing averaging £500,000. Traditional percentage-based fees from high-street agents typically range from 1% to 3% plus VAT, though negotiation is often possible, particularly for higher-value properties where the absolute fee is more substantial.
Online agents present an alternative for sellers seeking to minimize upfront costs, typically charging fixed fees between £999 and £1,999 including VAT regardless of property value. This model can prove advantageous for properties at the lower end of Newbourne's market, where percentage fees might represent a larger proportion of the eventual sale price. However, the local knowledge and personal service offered by agents with established presence in the surrounding area may prove valuable for village properties where understanding of period features, heritage considerations, and local buyer preferences can significantly impact sale outcomes. For properties with listed building status or those in the conservation area, the expertise of an agent familiar with Suffolk's heritage property market often proves worthwhile.

Start by understanding which agents operate in the Newbourne area and what their track records show. Look at their current listings, average asking prices, and how long properties typically stay on their books. Our live data shows which agents are most active in the village and what types of properties they handle.
Request free valuations from at least three agents before making your decision. This gives you comparison points on pricing strategy and reveals how each agent approaches valuing your specific property. An agent who understands Newbourne's period properties and the local market dynamics will provide a more accurate valuation.
Ask agents about their marketing strategies, including online presence, photography quality, and how they plan to showcase your property to potential buyers. In a village market where properties can be niche, targeted marketing to the right buyer database makes a difference.
Clarify whether agents charge percentage-based fees, fixed fees, or hybrid models. Remember that the cheapest option is not always the best value if they achieve a lower sale price. For Newbourne properties, consider what local expertise is worth to you.
Review the sole agency or multi-agency agreement carefully, including the contract duration typically ranging from 8 to 16 weeks and notice period requirements. Ensure you understand what happens if you want to change agents or if your property does not sell.
Choose an agent you feel confident working with, who understands your objectives and communicates clearly throughout the selling process. Your agent should be someone you can trust to represent your property professionally to prospective buyers.
Consider asking agents about their experience selling period properties in Newbourne specifically. Properties with heritage considerations or unique period features often benefit from agents who understand what buyers in this market segment are seeking.
The bedroom distribution across Newbourne's current listings reveals clear market segmentation that sellers should understand when pricing their properties. Two-bedroom properties dominate the market with 6 active listings averaging £168,833, representing the most accessible price point for first-time buyers and those seeking a manageable village home. This segment shows strong activity and suggests healthy demand from buyers entering the property market or downsizing.
Three-bedroom properties occupy a middle ground in Newbourne, with one current listing averaging £500,000. These family-sized homes typically attract buyers seeking more space while remaining within the village context, though the limited supply suggests either strong previous sales in this category or owners not currently bringing properties to market. The premium segment features five-bedroom homes with one listing averaging £750,000, representing the top end of Newbourne's housing market and likely attracting buyers seeking substantial period properties or modern family homes with generous accommodation.

Achieving the best possible price for your Newbourne property requires strategic pricing from the outset, informed by accurate local market knowledge rather than optimistic aspirations. The recent price volatility in the village, with Rightmove reporting values 38% below the 2021 peak, underscores the importance of pricing realistically based on current market conditions rather than historical highs. Properties priced correctly from the start tend to attract more viewings, generate competitive interest, and achieve sales more quickly than those requiring subsequent price reductions.
Negotiating agent fees represents another opportunity to maximize your net proceeds, particularly for higher-value properties where percentage-based fees represent substantial sums. Many agents maintain flexibility in their fee structures, especially for properties over £500,000 or when instructing on a sole agency basis. Requesting a written quote that details exactly what is included in their service, from marketing materials to viewings and negotiation, helps ensure you are comparing like-for-like when making your final decision. Given that the average asking price in Newbourne sits at £282,874, even a small percentage reduction in fees can translate to meaningful savings.
Presentation matters significantly in a village market where properties often have unique character and period features. Ensuring your property looks its best through professional photography and accurate descriptions helps attract serious buyers. Agents with experience marketing properties in Newbourne will understand which features to highlight, whether it is original fireplaces, exposed beams, or the attractive village location near The Street.
7 properties currently listed across Newbourne. Here are the most recently added.
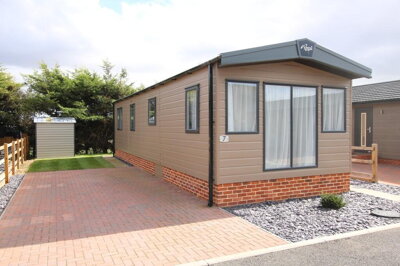
£157,995
Mobile Home, 2 bed
Watermill Road, IP12 4NW
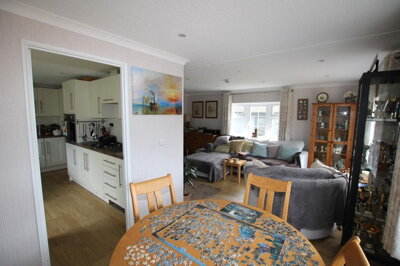
£157,995
Mobile Home, 2 bed
Watermill Road, IP12 4NW
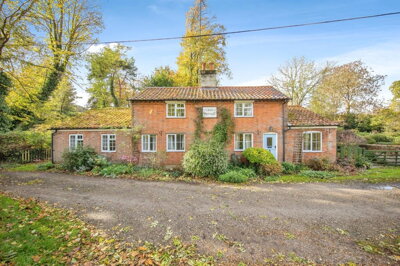
£500,000
Detached, 3 bed
Fenn Lane, IP12 4NZ
£500,000
Detached, 3 bed
Fenn Lane, IP12 4NZ
 New Build
£95,000
Mobile Home, 2 bed
Ipswich Road, IP12 4NS
New Build
£95,000
Mobile Home, 2 bed
Ipswich Road, IP12 4NS
 New Build
£165,000
Mobile Home, 2 bed
Ipswich Road, IP12 4NS
New Build
£165,000
Mobile Home, 2 bed
Ipswich Road, IP12 4NS
£170,000
Mobile Home, 2 bed
Watermill Road, IP12 4NW
£170,000
Mobile Home, 2 bed
Watermill Road, IP12 4NW
 New Build
£215,000
Mobile Home, 2 bed
Ipswich Road, IP12 4NS
New Build
£215,000
Mobile Home, 2 bed
Ipswich Road, IP12 4NS
 New Build
£210,000
Mobile Home, 2 bed
Ipswich Road, IP12 4NS
New Build
£210,000
Mobile Home, 2 bed
Ipswich Road, IP12 4NS
Get free, no-obligation valuations from the top-performing local agents. Compare fees, services, and track records before you decide.
Compare Agents FreeBased on our live market data, James & Co currently leads the Newbourne market with 75% market share across 6 active listings, focusing on properties averaging £168,833. Diamond Mills & Co and William H. Brown serve the premium segment with listings at £750,000 and £500,000 respectively. The best agent for your property depends on your price point and specific requirements, so comparing valuations from multiple agents is recommended. We track which agents are most active in the village and what types of properties they successfully market.
Estate agent fees in England typically range from 1% to 3% plus VAT of the final sale price. In Newbourne, for a property at the average asking price of £282,874, this would translate to fees between approximately £2,829 and £8,486 including VAT. Some agents offer fixed-fee alternatives, particularly online platforms, which may suit lower-value properties. High-street agents in surrounding towns like Woodbridge and Felixstowe may offer negotiated rates for properties at the higher end of the market, where the absolute fee is more substantial.
Current data presents a mixed picture. Rightmove reports prices approximately 52% above the previous year in their measurement, though this relates to transaction volumes rather than steady growth. More concerning is that prices remain 38% below the 2021 peak of £676,500. OnTheMarket indicates a 12.4% fall over the last 12 months. The relatively small number of transactions in this village means average figures can shift significantly based on which properties have sold. Sellers should obtain a current valuation specific to their property rather than relying solely on broad market averages.
Newbourne offers a peaceful Suffolk village lifestyle between the Rivers Orwell and Deben, with period properties along The Street creating traditional character. The village has limited immediate amenities but benefits from proximity to Woodbridge and Felixstowe for shopping and services. Historical buildings including the Grade I listed Church of St Mary and the Grade II* Newbourne Hall contribute to the village's heritage appeal. The Fox public house provides the main social venue within the village itself, while residents enjoy attractive countryside walks and waterside views from the peninsula setting.
Our live data shows 8 properties currently listed for sale in Newbourne across 3 active estate agents. This includes 1 property under £100,000, 3 properties in the £100,000 to £200,000 range, 2 properties in the £200,000 to £300,000 bracket, and premium listings above £500,000. The limited stock reflects the village's small size and suggests competitive demand when suitable properties become available. Two-bedroom properties dominate with 6 listings, while three and five-bedroom homes represent the upper market segments.
Two-bedroom properties currently dominate the market with 6 listings, suggesting strong demand from first-time buyers and those seeking smaller homes. Detached properties at the premium end, with 2 listings averaging £625,000, appeal to families and buyers seeking more substantial accommodation. Period cottages and character homes in the village centre typically attract buyers seeking the authentic Newbourne lifestyle. Properties along The Street command premium prices due to their period features and central location, with values per square foot reaching approximately £369.
New build activity within Newbourne village remains limited, with no large-scale residential developments identified. Planning applications exist for small developments including two homes on Mill Road and a property at Oak View Farm, but these represent incremental additions rather than substantial new communities. One barn conversion currently marketed represents the primary new build option available. For buyers seeking newer build properties, the Taylor Wimpey Brightwell Lakes development in nearby Martlesham offers maisonettes and apartments. Holiday lodges at Lakeside provide alternative options from £176,000 to £230,000, though these offer twelve-month occupancy rather than standard residential purchases.
The choice depends on your priorities. Local agents with offices in surrounding towns like Woodbridge and Felixstowe understand the village's character and heritage considerations that affect period properties. James & Co's dominant market share suggests they effectively serve the Newbourne market at the more accessible price points. Online agents offer lower fixed fees but may provide less local insight. For premium properties, period homes with listed building considerations, or properties in the conservation area near The Street, local expertise often proves valuable in reaching the right buyers and achieving optimal sale prices.
When choosing an estate agent in Newbourne, look for someone with proven experience in the Suffolk village market, particularly with period properties. Ask about their knowledge of local heritage considerations and their track record with properties similar to yours. Check how many listings they have in the village and how long their properties stay on the market. A good agent should be able to explain their pricing strategy and provide comparable sales data specific to Newbourne and surrounding villages. Communication style matters too, as you will be working closely with them through the sale process.
From £300
Essential for any property purchase, identifying key issues
From £500
Detailed structural survey for older properties
From £60
Energy performance certificate required for sale
Free
Official valuation for mortgage purposes
Estate Agents In London

Estate Agents In Plymouth

Estate Agents In Liverpool

Estate Agents In Glasgow

Estate Agents In Sheffield

Estate Agents In Edinburgh

Estate Agents In Coventry

Estate Agents In Bradford

Estate Agents In Manchester

Estate Agents In Birmingham

Estate Agents In Bristol

Estate Agents In Oxford

Estate Agents In Leicester

Estate Agents In Newcastle

Estate Agents In Leeds

Estate Agents In Southampton

Estate Agents In Cardiff

Estate Agents In Nottingham

Estate Agents In Norwich

Estate Agents In Brighton

Estate Agents In Derby

Estate Agents In Portsmouth

Estate Agents In Northampton

Estate Agents In Milton Keynes

Estate Agents In Bournemouth

Estate Agents In Bolton

Estate Agents In Swansea

Estate Agents In Swindon

Estate Agents In Peterborough

Estate Agents In Wolverhampton

Compare 3 local agents, data from 8 active listings
Find AgentsHomemove is a trading name of HM Haus Group Ltd (Company No. 13873779, registered in England & Wales). Homemove Mortgages Ltd (Company No. 15947693) is an Appointed Representative of TMG Direct Limited, trading as TMG Mortgage Network, which is authorised and regulated by the Financial Conduct Authority (FRN 786245). Homemove Mortgages Ltd is entered on the FCA Register as an Appointed Representative (FRN 1022429). You can check registrations at NewRegister or by calling 0800 111 6768.
We use cookies to show you personalised content and improve your experience of our website. Find out more in our Privacy policy and Cookie policy.