£425,000
Terraced, 3 bed
Station Road, OX39 4QD
£425,000
Terraced, 3 bed
Station Road, OX39 4QD

Compare 17 local agents, data from 111 active listings


We track 17 estate agents actively marketing properties in Chinnor, and we've ranked them all based on live listing data. selling a family home in the village centre or a countryside property on the outskirts, finding the right agent can make a significant difference to your sale price and timeline. Our comparison tool helps you cut through the options and connect with the agents who know this local market best.
The Chinnor property market has shown resilience despite broader national fluctuations, with the average asking price currently sitting at £552,180. This South Oxfordshire village has attracted buyers seeking a balance between rural charm and excellent commuter links, with the M40 providing straightforward access to Oxford, London, and the Thames Valley corridor. The current inventory of 111 properties for sale offers good choice across all price ranges, from starter homes around £280,000 to premium properties exceeding £1 million.
Our ranking system evaluates each agent on their active listings, average asking prices, and market presence within Chinnor and the surrounding OX39 postcode area. We update this data daily, so you can make informed decisions based on what's actually happening in the market right now, not outdated averages or self-reported performance figures.

17
Active Estate Agents
£552,180
Average Asking Price
111
Properties For Sale
The Chinnor housing market presents a picture of steady growth with some interesting nuances. According to Rightmove, the average house price in Chinnor stands at £521,560, representing an 11% increase compared to the previous year, though prices remain 1% below the 2022 peak of £528,157. Other sources show slightly different figures, with Zoopla reporting £537,790 and OnTheMarket indicating £467,000 as the average price paid, which reflects a 6.7% rise over the last twelve months. This variation between sources reflects different methodologies - Rightmove and Zoopla use asking prices while OnTheMarket focuses on sold prices.
The OX39 4 postcode sector, which covers Chinnor and surrounding villages, has seen house prices grow by approximately 4.0% in nominal terms over the past year according to Housemetric data. However, Property Solvers records show 76 residential property sales in the area over the last twelve months, representing a decrease of 30.26% compared to the previous year. This suggests that while prices have held steady, transaction volumes have softened in line with broader national trends, meaning sellers may need to be patient and price competitively to achieve a sale.
Detached properties command the highest prices in Chinnor, with Rightmove data showing an average of £672,786 and Zoopla indicating £743,417 for the last twelve months. Semi-detached homes average around £423,000-£430,000, while terraced properties sit at approximately £411,000-£422,000. Flats remain the most affordable option at an average of £242,167 according to Zoopla data, though these represent a small portion of available stock with just 8 current listings.
Based on 38 live listings with an average asking price of £617,026.
Source: home.co.uk
See which agents are selling fastest and at the best prices in Chinnor.
Compare Estate Agents FreeThe current inventory in Chinnor shows a healthy mix of property types, with 27 detached homes currently available at an average price of £764,628, reflecting the premium that buyers pay for space and privacy in this desirable South Oxfordshire village. These properties range from modern family homes to period residences, with some enjoying generous plots that offer potential for extension or annexe accommodation, subject to planning permission.
Semi-detached properties dominate the market with 30 listings at an average of £480,233, making them the most accessible option for families looking to enter the local market. Three-bedroom homes represent the largest segment of available stock, with 48 properties on the market at an average of £480,979. This aligns with family buyer demand, as three-bedroom houses offer versatile living space without reaching the premium price brackets. The two-bedroom market shows 26 listings at £353,269, while four-bedroom properties number 21 with an average price of £629,998.
Looking at price distribution, the majority of listings fall within the £300,000-£500,000 bracket, with 60 properties currently available. The £500,000-£750,000 range accounts for 28 listings, while properties over £750,000 number 16, including several premium detached homes and the rare opportunity to purchase properties over £1 million. This distribution suggests a balanced market with options for first-time buyers right through to those seeking luxury village residences.
Chinnor sits in South Oxfordshire, approximately 6 miles from Thame and 8 miles from High Wycombe, offering an enviable position between the Chilterns and the Oxfordshire countryside. The village maintains a strong community feel with local amenities including shops, pubs, and restaurants, while the nearby town of Thame provides additional retail and healthcare facilities. The area benefits from excellent transport links, with the M40 motorway accessible within a short drive, making it popular with commuters working in Oxford, London, or the Thames Valley corridor.
The village appeals to a range of buyers, from young families attracted by the good local schools in the area to professionals seeking a quieter lifestyle within reach of major employment centres. The surrounding countryside offers excellent walking and cycling opportunities, particularly along the Ridgeway long-distance footpath, which passes close to the village. Property buyers in Chinnor typically include both those moving up from smaller properties in nearby towns and families relocating from London and the Home Counties seeking more space for their money.
The local housing stock reflects its Oxfordshire location, with a mix of period properties alongside newer developments. While specific conservation area data wasn't available, properties in the village centre often feature traditional architecture that contributes to Chinnor's character. The semi-rural setting means some properties may benefit from larger gardens, which adds to the appeal for buyers seeking outdoor space, though prospective purchasers should factor in potential travel requirements for work and amenities not within walking distance.
The Chinnor market is well-served by both local specialists and national chains, giving sellers plenty of options when choosing representation. Parkers Estate Agents dominates the local market with 48 active listings representing a 43.2% market share, positioning them as the go-to agent for many sellers in the village. Their average asking price of £472,707 suggests they handle a strong volume of properties across various price points, making them a versatile choice for typical family homes in the £350,000-£600,000 range.
Bonners & Babingtons operates from their Chinnor office with 21 listings averaging £572,000, indicating they handle properties at the slightly higher end of the local market. This agent may prove particularly suitable for sellers of larger family homes or period properties seeking specialist local knowledge and a more personal service. For those with premium properties, Hamnett Hayward and Colombs Estate Agents both operate from nearby Thame and handle properties averaging over £1 million, suggesting experience with higher-value sales and clients expecting a more bespoke service.
When selecting an estate agent in Chinnor, consider whether you prefer a local office with intimate knowledge of the village or a broader network reaching more buyers. Fee structures typically range from 1-3% plus VAT, with most high-street agents offering percentage-based fees while some online alternatives provide fixed-rate packages. Always request a free valuation from multiple agents before instructing, as this allows you to compare their marketing strategies and fee proposals while ensuring you receive accurate local market appraisals that reflect current conditions in the Chinnor area.
Start by identifying agents with established presence in Chinnor. Look at their current listings, recent sales, and how long properties have been on the market. Pay attention to whether they actively advertise in the village and how they present properties online. Agents with strong local roots often have better connections with potential buyers and can negotiate more effectively on your behalf.
Book free valuations with at least three agents. Compare their suggested asking prices against your expectations and the current market data. Be wary of agents who suggest unrealistically high valuations just to win your business, as overpricing typically leads to longer marketing periods and eventual price reductions that can put off serious buyers.
Ask about each agent's marketing plan, including online presence, photography quality, and whether they use virtual tours or premium listing features. market, strong photography and detailed floorplans are essential. Find out which portals they advertise on, whether they use social media marketing, and how they plan to showcase your specific property to attract the right buyers.
Review contract terms carefully, including sole agency versus multi-agency options, contract duration typically 8-16 weeks, and any hidden fees. Understand what is included in their fee - some agents offer comprehensive marketing packages while others charge extra for things like EPCs, floorplans, or premium portal listings. Make sure you get everything in writing before signing.
Ensure you understand the notice period, what happens if you change agents, and the specific services included in their fee. Most contracts in the Chinnor area run for 8-16 weeks on a sole agency basis. Check whether you'll be tied in for the full period or can serve notice after a certain number of weeks if you're unhappy with the service.
Don't automatically choose the agent suggesting the highest valuation. The right agent is one who can actually achieve that price through proven local marketing, not just one who tells you what you want to hear. Our comparison tool shows you which agents consistently sell properties in your price range.
Understanding bedroom distribution helps sellers position their property competitively and helps buyers understand value in the local market. Four-bedroom properties represent a significant segment of the Chinnor market with 21 listings averaging £629,998, offering substantial space for growing families. These properties typically attract buyers seeking home office space or guest accommodation, with the premium over three-bedroom homes reflecting the additional square footage and flexibility that extra bedrooms provide for modern family living.
Five-bedroom properties, while fewer in number with just 8 listings, command an average of £890,000, representing the upper end of the family home market in Chinnor. These properties often feature multiple reception rooms, larger plots, and premium finishes that appeal to buyers willing to pay a premium for prestigious addresses. The ultra-premium segment includes six-bedroom homes averaging £1,781,250, though these represent a small portion of available stock and tend to be substantial period properties or executive homes in sought-after locations within the village.
For first-time buyers and those seeking more modest accommodation, one and two-bedroom properties provide entry points to the Chinnor market. Two-bedroom homes average £353,269 across 26 listings, offering an affordable route onto the property ladder in this desirable village location. One-bedroom properties average £280,000 based on just 2 current listings, suggesting strong demand from first-time buyers that often leads to competitive situations for these more affordable options. The limited supply of smaller properties means they tend to sell quickly when correctly priced.
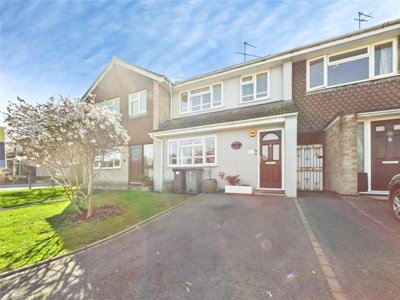
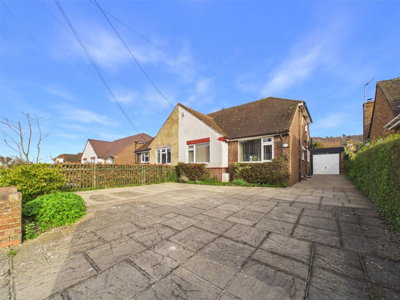
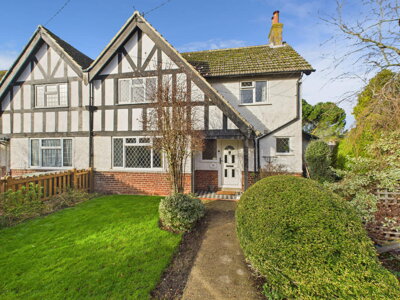
38 properties currently listed across Chinnor. Here are the most recently added.
£425,000
Terraced, 3 bed
Station Road, OX39 4QD
£425,000
Terraced, 3 bed
Station Road, OX39 4QD
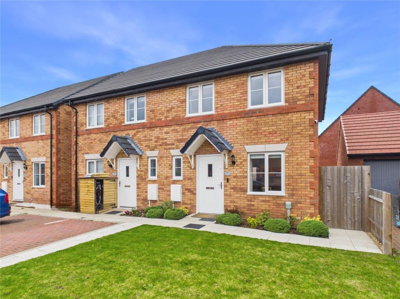
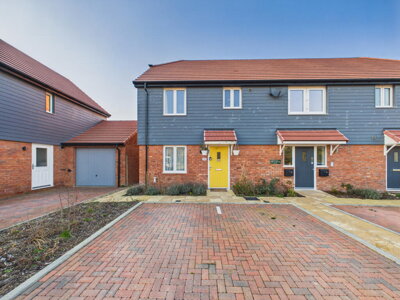
£400,000
Semi-Detached, 2 bed
Swallowtail Road, OX39 4GQ
£400,000
Semi-Detached, 2 bed
Swallowtail Road, OX39 4GQ
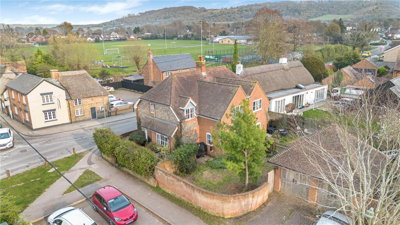
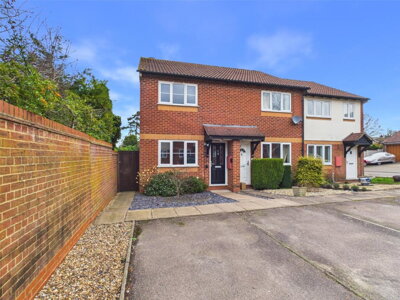
£425,000
Semi-Detached, 3 bed
Mill Lane, OX39 4QU
£425,000
Semi-Detached, 3 bed
Mill Lane, OX39 4QU
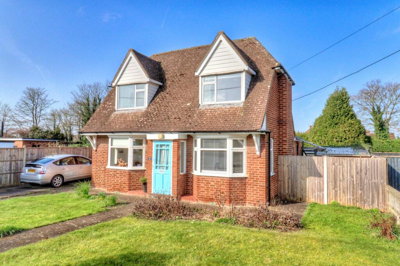
£450,000
Detached, 3 bed
Wykeham Rise, OX39 4PS
£450,000
Detached, 3 bed
Wykeham Rise, OX39 4PS
£425,000
Bungalow, 2 bed
Wykeham Rise, OX39 4PS
£425,000
Bungalow, 2 bed
Wykeham Rise, OX39 4PS
£225,000
Apartment, 2 bed
OX39 4JP
£225,000
Apartment, 2 bed
OX39 4JP
£240,000
Maisonette, 1 bed
Swallowtail Road, OX39 4GQ
£240,000
Maisonette, 1 bed
Swallowtail Road, OX39 4GQ
 New Build
£380,000
Apartment, 2 bed
Crowell Road, OX39 4HP
New Build
£380,000
Apartment, 2 bed
Crowell Road, OX39 4HP
£425,000
End of Terrace, 3 bed
Lime Grove, OX39 4PN
£425,000
End of Terrace, 3 bed
Lime Grove, OX39 4PN
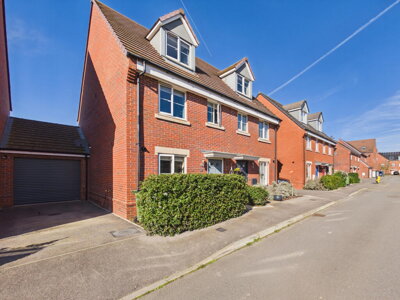
£500,000
Town House, 3 bed
Red Kite Road, OX39 4DG
£500,000
Town House, 3 bed
Red Kite Road, OX39 4DG

£3,950,000
Equestrian Facility, 6 bed
Chinnor Hill, OX39 4BB
£3,950,000
Equestrian Facility, 6 bed
Chinnor Hill, OX39 4BB
£385,000
End of Terrace, 2 bed
Timber Way, OX39 4EU
£385,000
End of Terrace, 2 bed
Timber Way, OX39 4EU
Get free, no-obligation valuations from the top-performing local agents. Compare fees, services, and track records before you decide.
Compare Agents FreeBased on current market data, Parkers Estate Agents leads with 43.2% market share and 48 active listings, making them the most active agent in the area. Bonners & Babingtons follows with 18.9% market share and 21 listings averaging £572,000. The best agent for your property depends on your specific circumstances, property type, and target price range. Parkers handles the volume market well, while Bonners & Babingtons appears stronger in the higher price brackets. Consider what matters most to you - local knowledge, marketing reach, or fee structure - when making your decision.
Estate agent fees in Chinnor typically range from 1% to 3% plus VAT (1.2% to 3.6% total) of the sale price, which aligns with national averages. Most high-street agents charge percentage-based fees, while online agents may offer fixed-fee packages typically between £999 and £1,999. Always compare what's included in the fee, as more comprehensive marketing packages including professional photography, virtual tours, and premium portal listings may justify higher charges. Ask specifically what you get for your money and whether there are any optional extras that might be offered at additional cost during the marketing period.
House prices in Chinnor have shown mixed signals recently. Rightmove reports prices 11% up on the previous year, while Property Solvers indicates a 1.12% decrease. OnTheMarket shows a 6.7% rise, and the OX39 4 postcode sector shows 4.0% nominal growth according to Housemetric. The variation reflects different methodologies between sources - some track asking prices while others focus on achieved sale prices. Overall, prices appear to have stabilised after the 2022 peak, with modest growth in recent months suggesting a healthy market where properties are still selling, albeit at a slower pace than the boom years.
Chinnor offers an attractive village lifestyle in South Oxfordshire with good local amenities, including shops, pubs, and restaurants. The area benefits from excellent transport links via the M40, making it popular with commuters to Oxford, London, and the Thames Valley - many professionals choose Chinnor for its balance of rural charm and accessibility. The surrounding countryside provides ample walking and cycling opportunities, particularly along the Ridgeway long-distance footpath. Schools in the area are generally well-regarded, making it popular with families who appreciate the combination of village community and good educational options.
Currently there are 111 properties for sale in Chinnor across all estate agents tracked by our system. The market shows a good mix of property types, with semi-detached homes leading the way with 30 listings, followed by detached properties at 27 listings. Three-bedroom homes represent the largest segment with 48 listings, followed by two-bedroom properties at 26 listings, suggesting strong demand from family buyers. This inventory level provides reasonable choice for buyers while indicating a healthy market where sellers can expect interest if their property is competitively priced and well-presented.
The most expensive properties currently listed in Chinnor include premium detached homes and large period properties. Hamnett Hayward has a listing at £1,150,000, while Colombs Estate Agents markets a property at £1,195,000 representing a substantial family home. Savills has a listing at £3,950,000, representing an exceptional premium property that would be considered a mansion or country house. Four and five-bedroom homes typically command the highest prices in the £600,000-£900,000 range, with premium features such as large plots, period features, and modern extensions driving values at the upper end of the market.
Both local and national agents operate in Chinnor, each offering distinct advantages. Local agents like Parkers and Bonners & Babingtons have established offices in the village with in-depth knowledge of the local market, community ties, and understanding of what buyers are looking for in this specific area. National chains such as Connells and Chancellors operate from nearby Thame and can offer broader marketing reach across their networks. Consider what matters most to you - if local expertise and personal service are priorities, a local agent may be preferable, while those wanting maximum exposure might benefit from a larger network.
While specific data for Chinnor wasn't available, the average time to sell in the South Oxfordshire area typically ranges from 8 to 16 weeks, depending on property type, pricing, and market conditions. Properties priced correctly according to current market data tend to sell faster, with the first few weeks seeing the highest level of interest from new listings. Overpriced homes can stagnate for months, accumulating viewings but no offers, which often leads to eventual price reductions that can damage buyer perception. Working with an experienced local agent helps ensure your property is positioned competitively from day one, maximising interest and achieving a sale within your timeframe.
Effective estate agent marketing in Chinnor should include professional photography that showcases your property's best features, detailed descriptions that highlight local amenities and transport links, and floorplans that help buyers visualise the space. Virtual tours have become increasingly important, particularly for buyers relocating from London or the Home Counties who may not be able to view in person initially. Premium listings on Rightmove and Zoopla can significantly increase exposure, while social media marketing extends reach to potential buyers who may not be actively searching but might be encouraged to consider a move to Chinnor. Ask prospective agents exactly what marketing they will undertake and confirm details in writing before instructing.
From £400
Essential for any property purchase - identifies issues before you commit
From £600
Comprehensive structural survey for older or converted properties
From £80
Required by law before selling - shows energy efficiency
From £150
Official valuation for Help to Buy, Shared Ownership, or remortgaging
Estate Agents In London

Estate Agents In Plymouth

Estate Agents In Liverpool

Estate Agents In Glasgow

Estate Agents In Sheffield

Estate Agents In Edinburgh

Estate Agents In Coventry

Estate Agents In Bradford

Estate Agents In Manchester

Estate Agents In Birmingham

Estate Agents In Bristol

Estate Agents In Oxford

Estate Agents In Leicester

Estate Agents In Newcastle

Estate Agents In Leeds

Estate Agents In Southampton

Estate Agents In Cardiff

Estate Agents In Nottingham

Estate Agents In Norwich

Estate Agents In Brighton

Estate Agents In Derby

Estate Agents In Portsmouth

Estate Agents In Northampton

Estate Agents In Milton Keynes

Estate Agents In Bournemouth

Estate Agents In Bolton

Estate Agents In Swansea

Estate Agents In Swindon

Estate Agents In Peterborough

Estate Agents In Wolverhampton

Compare 17 local agents, data from 111 active listings
Find AgentsHomemove is a trading name of HM Haus Group Ltd (Company No. 13873779, registered in England & Wales). Homemove Mortgages Ltd (Company No. 15947693) is an Appointed Representative of TMG Direct Limited, trading as TMG Mortgage Network, which is authorised and regulated by the Financial Conduct Authority (FRN 786245). Homemove Mortgages Ltd is entered on the FCA Register as an Appointed Representative (FRN 1022429). You can check registrations at NewRegister or by calling 0800 111 6768.
We use cookies to show you personalised content and improve your experience of our website. Find out more in our Privacy policy and Cookie policy.