£150,000
Semi-Detached Bungalow, 3 bed
Dinningside, NE70 7NP
£150,000
Semi-Detached Bungalow, 3 bed
Dinningside, NE70 7NP

Compare 13 local agents, data from 36 active listings


We track 13 estate agents actively marketing properties in Belford, Northumberland, and we've ranked them all based on live listing data, market share, and average asking prices. selling a period cottage in the village centre or a modern family home near the A1, finding the right agent can make a significant difference to your sale.
Belford sits nestled in the Northumberland countryside, roughly halfway between Alnwick and Berwick-upon-Tweed. The village offers a blend of historic charm with newer developments, and current market data shows properties ranging from £100,000 to over £500,000. With an average asking price of £319,222 across 36 active listings, the local market presents opportunities for both sellers and buyers in this picturesque Northumbrian village.

13
Active Estate Agents
£319,222
Average Asking Price
36
Properties For Sale
The Belford housing market reflects the broader Northumbrian countryside trends, with our live data showing an average asking price of £319,222 across 36 current listings. However, it's important to look beyond asking prices to understand what properties actually sell for. Land Registry and Rightmove data indicates that average sold prices in the NE70 postcode area have fluctuated significantly, with recent figures around £222,444 to £235,000 depending on the source. Historical context matters considerably here, as Rightmove data shows sold prices over the last year were approximately 26% down on the previous year and 29% below the 2008 peak of £312,094.
Property values in specific streets within Belford show varying trajectories. West Street, for instance, experienced prices 31% down on the previous year and a dramatic 56% down from its 2023 peak of £350,000. Meanwhile, South Road has shown more resilience with prices only 7% down from its 2012 peak of £270,000. These sector-level variations highlight why understanding the local micro-market is essential when pricing your property or making a purchase decision.
Three-bedroom properties dominate the current market, with 18 listings at an average of £329,389, representing the largest segment. Two-bedroom properties follow with 10 listings averaging £242,800, while four-bedroom homes command premium prices averaging £495,000 across just 4 available properties. This distribution suggests strong demand for family-sized homes in the area, while the limited supply of larger properties indicates potential for sellers in that bracket.
Based on 21 live listings with an average asking price of £330,476.
Source: home.co.uk
See which agents are selling fastest and at the best prices in Belford.
Compare Estate Agents FreeUnderstanding what's currently available and selling in Belford helps contextualise the market position. Terraced properties lead the listing count with 9 homes currently on the market, averaging £263,222, making them the most accessible entry point to the local housing market. Detached properties, while fewer in number at 6 listings, command the highest average prices at £446,667, reflecting the premium that buyers pay for space and character in this rural Northumberland setting.
The new build sector has been active in Belford, with several significant developments contributing to housing supply. South Meadows, developed by Ida Homes, offers 2, 3, 4, and 5-bedroom houses and bungalows ranging from £380,000 to £615,000, located within a short walk of the village high street. NB Clark completed a substantial development of 90 new homes in the heart of the old coaching village, while Sanderson Young markets North Farm Steading in nearby Warenford, offering six stone-built cottages from £360,000. These new builds represent modern construction methods including timber frames, solar panels, and air source heat pumps.
Belford is a sustainable village with excellent amenities, positioned approximately 4 kilometres inland from the east coast. The village sits within easy reach of major attractions including Bamburgh Castle and Holy Island, making it appealing for both permanent residents and those seeking holiday let opportunities. The local economy has historical roots in woollen manufacturing, tanneries, collieries, and lime kilns, though today the area benefits from its strategic position along the A1 trunk road and proximity to the East Coast Mainline railway.
The geological landscape influences property characteristics throughout the area. Northumberland's characteristic sandstone features prominently in local construction, with many buildings using thickly bedded or massive fluvial sandstone. Limestone ashlar and Welsh slate roofs are common on period properties, while whinstone (dolerite) outcrops to the north and north-east. The presence of Carboniferous sandstones, shales, and limestones, combined with historical coal workings to the south and south-west, means some properties may sit on ground with potential for mining-related stability considerations.
Flood risk is a notable factor in Belford, with the village experiencing flooding from the Belford Burn on ten occasions between 1997 and 2007. However, a Natural Flood Management Scheme has been implemented, including 35 Run-off Attenuation Features, which have significantly reduced flood impact with only one property affected since completion. Prospective buyers should enquire about flood risk for specific properties, particularly those near the watercourse running through the village centre. The village centre itself is designated as a Conservation Area with approximately 48 listed buildings, including the Grade I listed Belford Hall, meaning heritage considerations often apply to property transactions in the village core.
Selecting the right estate agent in Belford requires understanding the local market dynamics and which agents actively serve the area. Our data shows Rook Matthews Sayer currently leads the market with 13.9% market share across 5 active listings at an average asking price of £290,800. They operate from Alnwick and have established a strong presence in the North Northumberland market. For those seeking premium properties, Bradley Hall handles the upper end of the market with an average asking price of £417,500 across their 4 listings, also operating from Alnwick.
Pattinson Estate Agents offers another established option with 3 listings averaging £216,333, representing more affordable entry points to the Belford market. Sanderson Young, another Alnwick-based agency, focuses on higher-value properties with an average asking price of £400,000 across their 3 listings. For sellers with unique or character properties, Northumberland Properties (Alnwick) currently markets properties averaging £490,000, the highest average among active agents, suggesting they may have particular success with premium and luxury homes in the region.
When choosing between agents, consider whether an online model or traditional high-street presence better suits your needs. Online agents typically charge fixed fees ranging from £999 to £1,999, while high-street agents in this area generally work on percentage commissions of 1-3% plus VAT. The average estate agent fee across England is approximately 1.5% plus VAT, though this can vary based on the level of service and whether you opt for sole or multi-agency arrangements. Always request free valuations from multiple agents before making your decision.

Start by identifying which agents actively operate in Belford and the surrounding Northumberland area. Look at their current listings, average asking prices, and how long properties typically stay on their books.
Request free valuations from at least three different agents. This gives you a realistic picture of your property's market value and allows you to compare the agents' approaches and professionalism.
Ask about how agents plan to market your property. In a village like Belford with its Conservation Area and 48 listed buildings, specialist knowledge of heritage properties can be valuable.
Clarify whether fees are fixed or percentage-based, and what's included in the service. Remember that the cheapest option is not always the best value.
Look for agents with relevant professional memberships and client testimonials. Local knowledge of the NE70 area and experience with properties similar to yours matters.
Do not be afraid to negotiate on fees or contract terms. Most agents have flexibility, particularly if you are selling a property in a competitive price range.
Before instructing any estate agent, always get at least three free valuations. In a village market like Belford, different agents may value your property differently based on their buyer databases and recent comparable sales. This comparison shopping could mean thousands of pounds difference in your final sale price.
The bedroom distribution across Belford properties reveals clear market segments that can help both buyers and sellers position their properties appropriately. Three-bedroom homes dominate the market with 18 listings averaging £329,389, representing half of all available stock. This suggests strong demand for family housing, though sellers should be aware of competitive pressure within this segment.
Two-bedroom properties offer the most accessible entry point with 10 listings averaging £242,800. These properties typically attract first-time buyers, young couples, and those looking to downsize. The relative affordability compared to three-bedroom homes, with an average price gap of around £86,600, makes this segment particularly attractive for budget-conscious purchasers.
Four-bedroom properties represent the premium end of the market with only 4 listings available at an average of £495,000. The limited supply in this segment could work to sellers' advantage, particularly if there is demand from families seeking larger accommodation in the village. Single-bedroom properties are rare with just 1 listing at £240,000, reflecting the limited demand for very small properties in this rural location.

Pricing strategy is crucial in the Belford market, where property values have shown significant variation across different streets and property types. Our data shows properties priced between £300,000 and £500,000 account for 14 of the 36 current listings, representing the sweet spot for mainstream family homes. Properties priced above £500,000 are rarer with just 3 listings, while the sub-£200,000 segment has 4 properties, typically comprising smaller flats or cottages requiring renovation.
Negotiating agent fees is standard practice, with most agents willing to discuss their commission rates. Typical fees range from 1% to 3% plus VAT, with the average around 1.5% plus VAT. If an agent quotes 2% plus VAT, try negotiating down to 1.5% or 1.75%, particularly if your property is in a desirable price range. Some agents may offer reduced fees in exchange for longer contract terms or multi-agency agreements, though these typically carry higher overall costs.
The valuation process deserves careful attention. Agents will provide a free valuation based on their analysis of comparable properties, current market conditions, and their knowledge of the Belford area. Be wary of agents who over-value your property to secure your instruction, as an overpriced property will languish on the market while similar properties sell around it. The most accurate valuations come from agents with active listings in your specific area and price range. Given the variability we have seen between streets, with West Street showing 31% annual decline while South Road shows only 7% decline from its peak, local knowledge really does matter when setting the right asking price.

21 properties currently listed across Belford. Here are the most recently added.
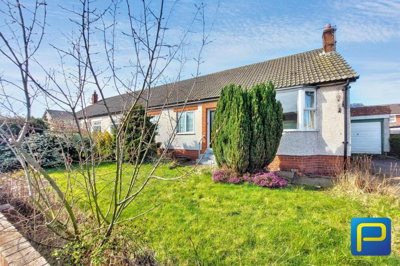
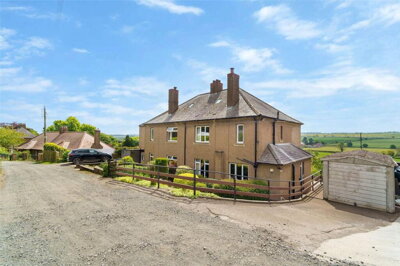
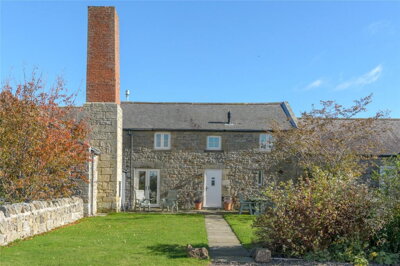
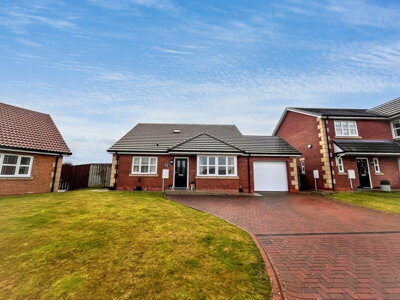
£150,000
Semi-Detached Bungalow, 3 bed
Dinningside, NE70 7NP
£150,000
Semi-Detached Bungalow, 3 bed
Dinningside, NE70 7NP
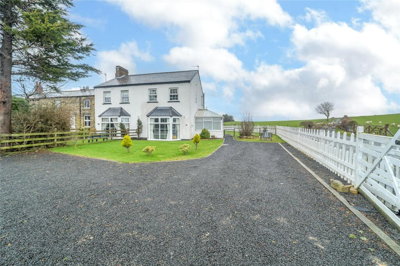
£260,000
Semi-Detached, 3 bed
Station Cottages, NE70 7DY
£260,000
Semi-Detached, 3 bed
Station Cottages, NE70 7DY
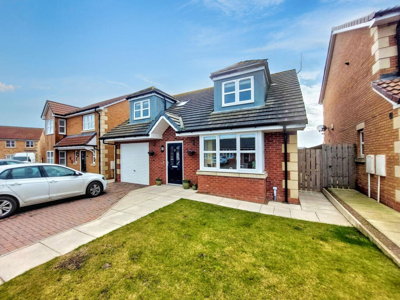
£345,000
Detached, 3 bed
Dunmoor Road, NE70 7PT
£345,000
Detached, 3 bed
Dunmoor Road, NE70 7PT
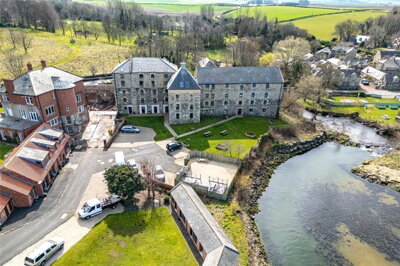
£240,000
Apartment, 3 bed
NE70 7EP
£240,000
Apartment, 3 bed
NE70 7EP
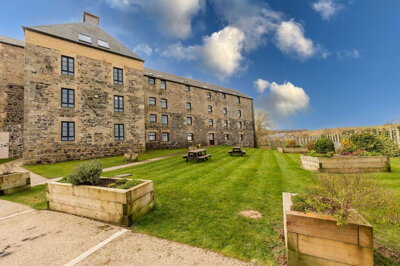
£285,000
Flat, 3 bed
NE70 7EP
£285,000
Flat, 3 bed
NE70 7EP
£295,000
Semi-Detached, 2 bed
Hillside Road, NE70 7NB
£295,000
Semi-Detached, 2 bed
Hillside Road, NE70 7NB
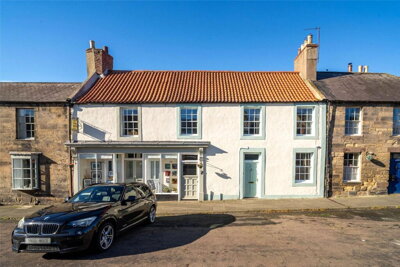
£299,999
Terraced, 3 bed
High Street, NE70 7NH
£299,999
Terraced, 3 bed
High Street, NE70 7NH
£250,000
Semi-Detached, 3 bed
Burnside, NE70 7QG
£250,000
Semi-Detached, 3 bed
Burnside, NE70 7QG
£425,000
Barn Conversion, 3 bed
NE70 7HW
£425,000
Barn Conversion, 3 bed
NE70 7HW
£360,000
Detached, 4 bed
Yeavering Court, NE70 7PD
£360,000
Detached, 4 bed
Yeavering Court, NE70 7PD
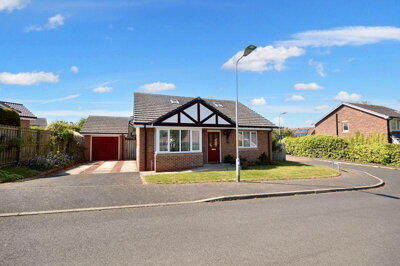
£310,000
Detached Bungalow, 3 bed
Croft Way, NE70 7ET
£310,000
Detached Bungalow, 3 bed
Croft Way, NE70 7ET
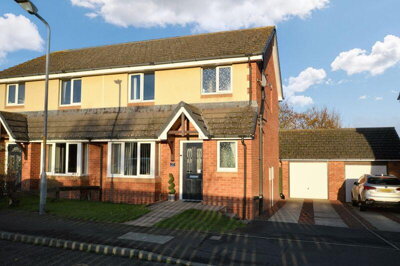
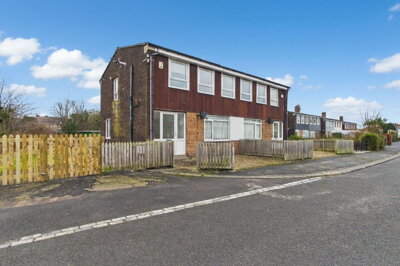
£235,000
Semi-Detached, 3 bed
Williams Way, NE70 7NX
£235,000
Semi-Detached, 3 bed
Williams Way, NE70 7NX
Get free, no-obligation valuations from the top-performing local agents. Compare fees, services, and track records before you decide.
Compare Agents FreeBased on our live market data, the leading agents by market share in Belford are Rook Matthews Sayer (13.9% market share, 5 listings), Bradley Hall (11.1% market share, 4 listings), and Pattinson Estate Agents (8.3% market share, 3 listings). The best agent for your property depends on your price range and property type, as each agent has different specialisations and average asking prices. Rook Matthews Sayer leads on volume, while Northumberland Properties focuses on premium properties averaging £490,000.
Estate agent fees in England typically range from 1% to 3% plus VAT (1.2% to 3.6% total). In the Belford area, you can expect to pay around 1.5% plus VAT for standard high-street representation, though fees can be negotiated. Online agents offer fixed-fee alternatives typically ranging from £999 to £1,999. For a property valued at £320,000, a 1.5% plus VAT fee would equate to approximately £5,760, while a 2% fee would be around £7,680.
Recent data from Rightmove indicates that sold prices in Belford over the last year were approximately 26% down on the previous year and 29% down on the 2008 peak of £312,094. However, different streets show varying trends, with West Street showing 31% decline while South Road shows more stability with only 7% decline from its 2012 peak. The market appears to be in a correction phase after the peak activity during the pandemic housing boom.
Belford is a sustainable Northumbrian village with excellent amenities, situated about 4km inland from the east coast. The village offers access to the A1 and East Coast Mainline railway, making it commutable to larger towns. With a population of around 1,313, it provides a close-knit community feel while being within reach of Alnwick and Berwick-upon-Tweed. The village has a Conservation Area and approximately 48 listed buildings, indicating strong heritage character. Local amenities include shops, pubs, and the nearby Sunnyhills Farm Shop.
The current market shows terraced properties as the most common listing type with 9 homes, followed by detached properties at 6 listings. Semi-detached and flats each account for 4 listings, with the remaining 13 properties falling into other categories. Three-bedroom homes dominate with 18 listings, reflecting strong family housing demand. The prevalence of period properties in the village centre, many of which are listed buildings, creates a distinctive architectural character.
Yes, several new build developments exist in and around Belford. South Meadows by Ida Homes offers 2-5 bedroom homes from £380,000 to £615,000, located within a short walk of the high street. NB Clark completed a development of 90 new homes in the village centre, representing significant recent housing growth. Sanderson Young markets North Farm Steading in nearby Warenford with six stone-built cottages from £360,000. These new builds utilise modern construction methods including timber frames, solar panels, and air source heat pumps.
Look for agents with active listings in the Belford area and experience with properties similar to yours. Consider their average asking prices relative to your property, their marketing approach, and their local knowledge. The village's Conservation Area and numerous listed buildings mean agents with heritage property experience can be particularly valuable. Always get multiple valuations before choosing, and pay attention to how well the agent knows the local street-by-street market variations.
The time to sell varies based on property type, price, and market conditions. Properties priced competitively within the current market average of £319,222 tend to attract stronger interest. Overpriced properties can sit on the market for months, while correctly priced homes in desirable condition may sell more quickly. Given the current market correction with prices down 26% year-on-year, realistic pricing is especially important. Your agent should provide realistic timeframe expectations based on current local data.
Given Belford's significant stock of older properties, including numerous listed buildings and those in the Conservation Area, a RICS Level 2 survey is strongly recommended. Common issues in older Northumbrian properties include dampness (particularly from inappropriate modern materials on traditional walls), roof condition concerns, potential subsidence from clay soils or historical mining activity, and outdated electrical systems. Properties in flood-risk areas near the Belford Burn may also require specific investigations. With around 48 listed buildings in the area, some properties may require more specialist historic building surveys beyond the standard RICS Level 2.
Estate Agents In London

Estate Agents In Plymouth

Estate Agents In Liverpool

Estate Agents In Glasgow

Estate Agents In Sheffield

Estate Agents In Edinburgh

Estate Agents In Coventry

Estate Agents In Bradford

Estate Agents In Manchester

Estate Agents In Birmingham

Estate Agents In Bristol

Estate Agents In Oxford

Estate Agents In Leicester

Estate Agents In Newcastle

Estate Agents In Leeds

Estate Agents In Southampton

Estate Agents In Cardiff

Estate Agents In Nottingham

Estate Agents In Norwich

Estate Agents In Brighton

Estate Agents In Derby

Estate Agents In Portsmouth

Estate Agents In Northampton

Estate Agents In Milton Keynes

Estate Agents In Bournemouth

Estate Agents In Bolton

Estate Agents In Swansea

Estate Agents In Swindon

Estate Agents In Peterborough

Estate Agents In Wolverhampton

Compare 13 local agents, data from 36 active listings
Find AgentsHomemove is a trading name of HM Haus Group Ltd (Company No. 13873779, registered in England & Wales). Homemove Mortgages Ltd (Company No. 15947693) is an Appointed Representative of TMG Direct Limited, trading as TMG Mortgage Network, which is authorised and regulated by the Financial Conduct Authority (FRN 786245). Homemove Mortgages Ltd is entered on the FCA Register as an Appointed Representative (FRN 1022429). You can check registrations at NewRegister or by calling 0800 111 6768.
We use cookies to show you personalised content and improve your experience of our website. Find out more in our Privacy policy and Cookie policy.