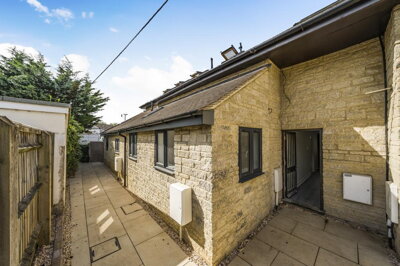
£1,500,000
Detached, 6 bed
Woodstock Road East, OX5 1RG
£1,500,000
Detached, 6 bed
Woodstock Road East, OX5 1RG

Compare 9 local agents, data from 17 active listings


We track 9 estate agents actively marketing properties in Begbroke, and we've ranked them all based on live listing data, market share, and average asking prices. selling a family home in the village centre or a premium property near the Oxfordshire countryside, finding the right agent makes all the difference to your sale.
Begbroke sits in the Cherwell district of Oxfordshire, offering a mix of historic charm and excellent transport links to Oxford city. With an average asking price of £532,794 across 17 current listings, the local market presents opportunities across multiple price points. Our comparison tool helps you connect with the agents who know this village best.

9
Active Estate Agents
£532,794
Average Asking Price
17
Properties For Sale
Understanding the local property market is essential before choosing an estate agent, and our data reveals some important trends for Begbroke sellers. According to recent Land Registry and Zoopla data, the average sold price in Begbroke over the last 12 months was approximately £349,250, though this figure has experienced notable correction. Historical sold prices were 26% down on the previous year and 46% down from the 2022 peak of £541,455, indicating a market adjustment period that experienced sellers should understand.
The OX5 1SH postcode area, which encompasses parts of Begbroke, shows similar patterns with sold prices averaging £230,000 over the last year, representing a 23% decline year-on-year and a 57% drop from the 2021 peak of £535,000. These sector-level variations are crucial context for pricing your property correctly. Properties on Spring Hill Road averaged £230,000, down 23% on the previous year and 71% down from their 2021 peak of £798,667, demonstrating how different streets within the same village can perform quite differently.
Transaction volumes provide additional market insight, with Rightmove recording 232 property sales in Begbroke over the last year. This level of activity, combined with the current 17 active listings, indicates a reasonably balanced market where properly priced properties can still attract motivated buyers. The current average asking price of £532,794 from our live data sits notably higher than recent sold prices, suggesting vendors may need to adjust expectations to achieve successful sales in the current climate.
The rental market in Begbroke shows modest activity with 3 properties currently available, managed by 2 agents. Chancellors handles 2 rental listings at an average of £2,050 per month, while Alistair Redhouse Property Partners offers 1 listing at £1,650 monthly. This rental data provides useful context for investors considering buy-to-let opportunities in the village, though the rental stock remains limited compared to the sales market.
Based on 12 live listings with an average asking price of £662,500.
Source: home.co.uk
See which agents are selling fastest and at the best prices in Begbroke.
Compare Estate Agents FreeThe property type mix in Begbroke reveals important patterns for sellers considering which agent to instruct. Our live listing data shows that "Other" properties dominate the current market with 11 listings averaging £479,318, suggesting a strong presence of bungalows, cottages, and period properties that define the village character. Flats represent 2 listings at an average of £237,500, offering more accessible entry points to the Begbroke market.
New build activity specifically within Begbroke (OX5 postcode) appears limited based on available research, with no active developments definitively verified within the village itself. However, the broader Oxford area between January and December 2025 recorded 387 new build sales averaging £525,000, with most new properties selling in the £500,000-£750,000 range. This suggests that while Begbroke itself has limited new stock, buyers seeking modern homes in the wider Cherwell area are active in this price bracket. The transaction volume of 232 sales in the last year demonstrates consistent market activity, though the split between property types indicates demand is weighted toward the traditional housing stock that gives Begbroke its village character.
Begbroke occupies a distinctive position in Oxfordshire, combining village intimacy with exceptional connectivity to Oxford city centre, approximately 5 miles away. The village falls within the Cherwell district and sits near the boundary with South Oxfordshire, giving residents access to excellent transport links including the A40 for commuting to Oxford and beyond. The presence of Begbroke Manor and surrounding historic properties suggests the area has conservation considerations that buyers and sellers should be aware of, potentially affecting renovation plans and mortgageability.
The local economy benefits significantly from proximity to Oxford's world-class universities, teaching hospitals, and the thriving science and technology sector centred around the city. This economic driver directly influences the Begbroke housing market, with many buyers seeking village life while working in Oxford's knowledge economy. The predominant construction in the village reflects traditional Oxfordshire building practices, typically involving local stone and brick, though specific details on building materials require site-specific surveys given the variation across properties.
Regarding environmental considerations, specific flood risk data for Begbroke was not detailed in available research, though buyers should conduct standard environmental searches given the proximity to water courses common in Oxfordshire valleys. The shrink-swell clay soils prevalent in parts of Oxfordshire can pose foundation risks, particularly for older properties, making professional surveys particularly valuable for properties over 50 years old. Schools in the catchment area serve families moving to the village, with several highly-rated primary and secondary options within reasonable driving distance.
The village maintains a intimate scale while benefiting from its position between Oxford and Woodstock. Properties range from period cottages around the village green to modern developments along the main road, giving buyers genuine variety. The A40 provides straightforward access to Oxford's eastern bypass, while the railway stations at Oxford Parkway and Bicester offer alternative transport options. This connectivity makes Begbroke particularly attractive to professionals working in Oxford but seeking a quieter home environment.
Choosing between online fixed-fee agents and traditional high-street estate agents is a key decision for Begbroke sellers, and the local market presents distinct options across both models. Alistair Redhouse Property Partners dominates the local market with 23.5% market share across 4 active listings at an average asking price of £458,750, operating from their Oxfordshire base with a strong presence in the village. Cherry Picked Residential and Breckon & Breckon each hold 11.8% market share, with Cherry Picked focusing on properties averaging £387,500 from their Oxford office while Breckon & Breckon operate from Woodstock with properties averaging £400,000.
Chancellors, part of the Leaders and Romans Group, represent another significant local option with 2 listings averaging £237,500 and an established high-street presence in nearby Kidlington. For sellers with premium properties, Strutt & Parker (BNP Paribas) hold listings at £1,000,000 average from their Oxford office, while Exp UK markets a £2,000,000 property demonstrating the ultra-premium end of the Begbroke market. Traditional percentage-based agents typically charge 1-3% plus VAT (1.2-3.6% total), while online agents offer fixed fees typically between £999-£1,999, though the local expertise and market knowledge that established agents bring can prove invaluable in a village market with specific characteristics.
Sole agency agreements typically run for 8-16 weeks, while multi-agency arrangements involve higher fees (usually +0.5-1%) but greater exposure. Given Begbroke's relatively small market with only 17 active listings, selecting an agent with proven local track record and strong marketing presence often proves more effective than purely comparing fee structures. We recommend obtaining free valuations from at least three agents before instructing, comparing not just their fees but their local market knowledge and proposed marketing strategy.

Start by reviewing the 9 agents actively operating in Begbroke. Look at their current listings, average asking prices, and market share to understand which agents operate in your price range.
Request free valuations from at least 3 different agents. Compare their suggested asking prices carefully, as inflated valuations often lead to properties sitting unsold.
Ask about each agent's marketing approach, including online presence, photography quality, and database of potential buyers. In a village market, agents with strong local networks can make a significant difference.
Do not accept the first fee offered. Estate agent fees in England typically range from 1-3% plus VAT, and many agents are willing to negotiate, particularly for higher-value properties.
Verify any claims about local experience and ask for recent examples of properties sold in Begbroke or surrounding villages. The data we provide shows real listing counts and market shares.
Once satisfied, formalise your agreement in writing. Ensure you understand the contract terms, including sole or multi-agency arrangements and the minimum contract period.
The average asking price in Begbroke currently sits at £532,794, but recent sold prices average around £349,250. For the best outcome, price your property competitively based on current market conditions rather than historic peaks.
Analysing property prices by bedroom count provides valuable insights for sellers positioning their property in the Begbroke market. Our live listing data reveals that 2-bedroom properties dominate the current market with 7 listings averaging £323,214, representing the most active segment and suggesting strong demand from first-time buyers and downsizers seeking village living at accessible price points. This bedroom count represents excellent value comparison for buyers and clear pricing benchmarks for sellers.
Three-bedroom properties form the next largest segment with 5 listings averaging £452,000, typically attracting families seeking the traditional village home with garden space. Four-bedroom properties represent 4 listings at an average of £633,750, appealing to buyers seeking larger family homes in a village location with good transport links. The market also includes one 7-bedroom property listed at £2,000,000, demonstrating Begbroke's capacity to attract ultra-high-net-worth buyers seeking substantial period properties in this desirable Oxfordshire village location.

Achieving the best price for your Begbroke property requires careful pricing strategy informed by current market data and realistic expectations. With the village experiencing price corrections from its 2022 peak, understanding local trends is essential. The current average asking price of £532,794 sits significantly above recent sold prices averaging £349,250, suggesting that properties priced realistically against comparable sales are most likely to achieve successful outcomes.
Your choice of estate agent significantly impacts both the achieved price and the speed of sale. Agents with strong local presence and market knowledge, such as Alistair Redhouse Property Partners with 23.5% market share, understand the nuances of the Begbroke market and can advise on optimal pricing strategies. Negotiating agent fees is standard practice, with typical charges ranging from 1-3% plus VAT. For a property valued at £500,000, this equates to fees between £6,000 and £18,000, making fee negotiations worthwhile conversations to have with prospective agents.
The price distribution across listings shows most properties (11) fall in the £300,000-£500,000 range, with 2 properties in the £200,000-£300,000 bracket and 2 premium properties exceeding £1,000,000. This distribution suggests the market serves both first-time buyers and those seeking higher-end village residences. Understanding where your property fits within this spectrum helps set realistic expectations and identifies which agents have the relevant experience for your specific situation.

12 properties currently listed across Begbroke. Here are the most recently added.
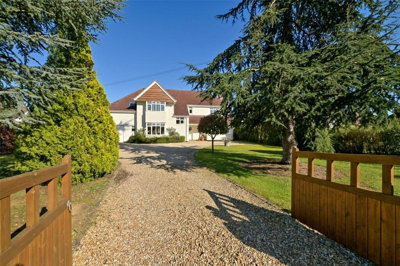
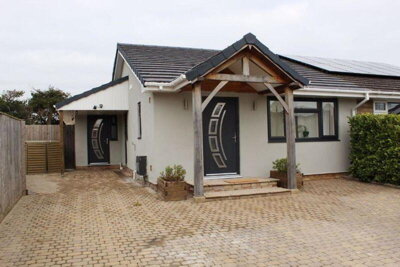
£1,500,000
Detached, 6 bed
Woodstock Road East, OX5 1RG
£1,500,000
Detached, 6 bed
Woodstock Road East, OX5 1RG
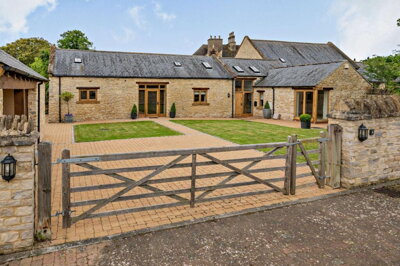
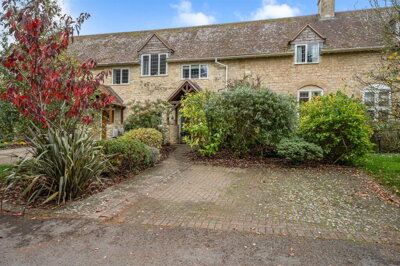
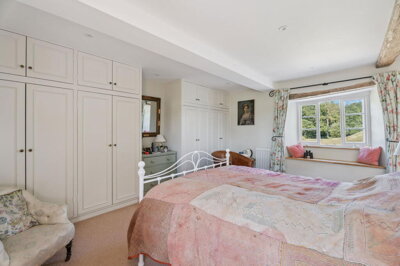
£1,000,000
Barn Conversion, 4 bed
Spring Hill Road, OX5 1FW
£1,000,000
Barn Conversion, 4 bed
Spring Hill Road, OX5 1FW

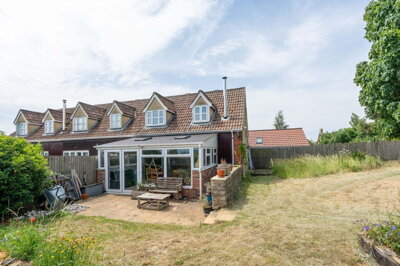
£400,000
Duplex, 3 bed
Spring Hill Road, OX5 1SH
£400,000
Duplex, 3 bed
Spring Hill Road, OX5 1SH
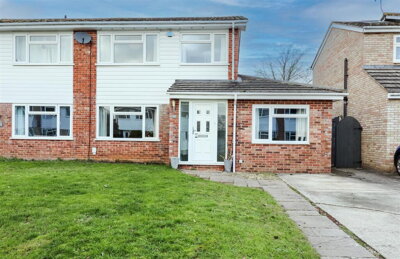
£485,000
Semi-Detached, 4 bed
Willow Way, OX5 1SD
£485,000
Semi-Detached, 4 bed
Willow Way, OX5 1SD
£375,000
Terraced, 2 bed
Wolsey Court, OX20 1QP
£375,000
Terraced, 2 bed
Wolsey Court, OX20 1QP
£425,000
Semi-Detached Bungalow, 3 bed
Quarry End, OX5 1SF
£425,000
Semi-Detached Bungalow, 3 bed
Quarry End, OX5 1SF
£350,000
Block of Apartments, 4 bed
Begbroke Crescent, OX5 1RW
£350,000
Block of Apartments, 4 bed
Begbroke Crescent, OX5 1RW
£595,000
Mews, 3 bed
Spring Hill Road, OX5 1SH
£595,000
Mews, 3 bed
Spring Hill Road, OX5 1SH
£2,000,000
Detached, 7 bed
OX5 1RX
£2,000,000
Detached, 7 bed
OX5 1RX
£240,000
Flat, 2 bed
Woodstock Road East, OX5 1RL
£240,000
Flat, 2 bed
Woodstock Road East, OX5 1RL
£235,000
Flat, 2 bed
Woodstock Road East, OX5 1RL
£235,000
Flat, 2 bed
Woodstock Road East, OX5 1RL
£345,000
Barn Conversion, 2 bed
Wolsey Court, OX20 1QP
£345,000
Barn Conversion, 2 bed
Wolsey Court, OX20 1QP
Get free, no-obligation valuations from the top-performing local agents. Compare fees, services, and track records before you decide.
Compare Agents FreeBased on our live market data, Alistair Redhouse Property Partners leads the Begbroke market with 23.5% market share and 4 active listings averaging £458,750. Cherry Picked Residential and Breckon & Breckon each hold 11.8% market share, while Chancellors also maintains strong presence with 11.8% market share. The best agent for your property depends on your price point and property type, as each agent focuses on different segments of the market. For premium properties over £500,000, Strutt & Parker and Flowers Estate Agents offer relevant experience, while Chancellors and Cherry Picked Residential serve the mid-market effectively.
Estate agent fees in England typically range from 1% to 3% plus VAT (1.2% to 3.6% total). For a property in Begbroke averaging £532,794, this means fees between approximately £6,393 and £19,180. Online agents offer fixed-fee alternatives typically between £999-£1,999, though traditional high-street agents often provide more personalized service and local market expertise. Given Begbroke's village market dynamics, the difference in service levels often proves significant for properties requiring specific local knowledge.
The data shows Begbroke has experienced significant price correction, with sold prices 26% down on the previous year and 46% down from the 2022 peak of £541,455. The OX5 postcode area shows similar trends, with prices down 23% year-on-year and 57% down from the 2021 peak of £535,000. Current market conditions favour realistic pricing over ambitious expectations, and sellers who price competitively based on recent comparable sales tend to achieve outcomes more quickly than those seeking historic peak values.
Begbroke offers village life in Cherwell, Oxfordshire, with excellent connectivity to Oxford city approximately 5 miles away. The village features character properties including Begbroke Manor, traditional Oxfordshire architecture using local stone and brick, and access to good schools in the catchment area. The proximity to Oxford's universities and science economy makes it attractive for professionals seeking village tranquility with city access. The A40 provides straightforward commuting, while the village maintains its own identity separate from the larger town of Kidlington nearby.
Our live data shows 17 properties currently listed for sale in Begbroke across 9 active estate agents. The market includes properties ranging from 2-bedroom flats at £237,500 to 7-bedroom homes at £2,000,000, with the majority of listings (11 properties) in the "Other" category typically representing bungalows and period cottages. This relatively limited inventory means competition among buyers for correctly priced properties can be modest but genuine.
The current market shows "Other" properties (bungalows, cottages, period homes) dominating with 11 listings averaging £479,318. Flats represent 2 listings, semi-detached properties 2 listings, with single listings each for detached (£2,000,000) and terraced (£400,000) properties. This mix reflects the village's traditional character, with limited new build stock and a housing stock primarily consisting of older period properties and bungalows rather than modern estates.
Specific days-on-market data for Begbroke was not available, but factors affecting sale speed include realistic pricing relative to recent sold prices (averaging £349,250), property type, and prevailing market conditions. Properties priced correctly against comparable sales typically achieve outcomes faster than those with ambitious asking prices. In the current market, properties priced at or below £350,000 tend to attract more immediate interest given the gap between asking and achieved prices.
Given Begbroke's small village market with only 17 active listings, local agents with established presence and market knowledge often provide advantages. Alistair Redhouse Property Partners, operating from Oxfordshire with 23.5% market share, demonstrates the value of local expertise. Online agents may offer lower fees but typically provide less personalized service and may lack specific local market knowledge that benefits village property sales. For properties in the premium segment, established high-street brands like Strutt & Parker offer marketing reach that smaller local operations cannot match.
Estate Agents In London

Estate Agents In Plymouth

Estate Agents In Liverpool

Estate Agents In Glasgow

Estate Agents In Sheffield

Estate Agents In Edinburgh

Estate Agents In Coventry

Estate Agents In Bradford

Estate Agents In Manchester

Estate Agents In Birmingham

Estate Agents In Bristol

Estate Agents In Oxford

Estate Agents In Leicester

Estate Agents In Newcastle

Estate Agents In Leeds

Estate Agents In Southampton

Estate Agents In Cardiff

Estate Agents In Nottingham

Estate Agents In Norwich

Estate Agents In Brighton

Estate Agents In Derby

Estate Agents In Portsmouth

Estate Agents In Northampton

Estate Agents In Milton Keynes

Estate Agents In Bournemouth

Estate Agents In Bolton

Estate Agents In Swansea

Estate Agents In Swindon

Estate Agents In Peterborough

Estate Agents In Wolverhampton

Compare 9 local agents, data from 17 active listings
Find AgentsHomemove is a trading name of HM Haus Group Ltd (Company No. 13873779, registered in England & Wales). Homemove Mortgages Ltd (Company No. 15947693) is an Appointed Representative of TMG Direct Limited, trading as TMG Mortgage Network, which is authorised and regulated by the Financial Conduct Authority (FRN 786245). Homemove Mortgages Ltd is entered on the FCA Register as an Appointed Representative (FRN 1022429). You can check registrations at NewRegister or by calling 0800 111 6768.
We use cookies to show you personalised content and improve your experience of our website. Find out more in our Privacy policy and Cookie policy.